SPY July 8th 2025SPY July 8th 2025
Day 2 of journaling my trades. Ended Monday green but not without mistakes. I am heading into Tuesday with more of a neutral outlook. Previous resistance will be tested as support and could find buyers or fail to do so. As I did yesterday, I will give a breakdown of what I’m seeing on all of my charts for both strategies.
+++++++++++++++++++++++++++
Bullish Analysis
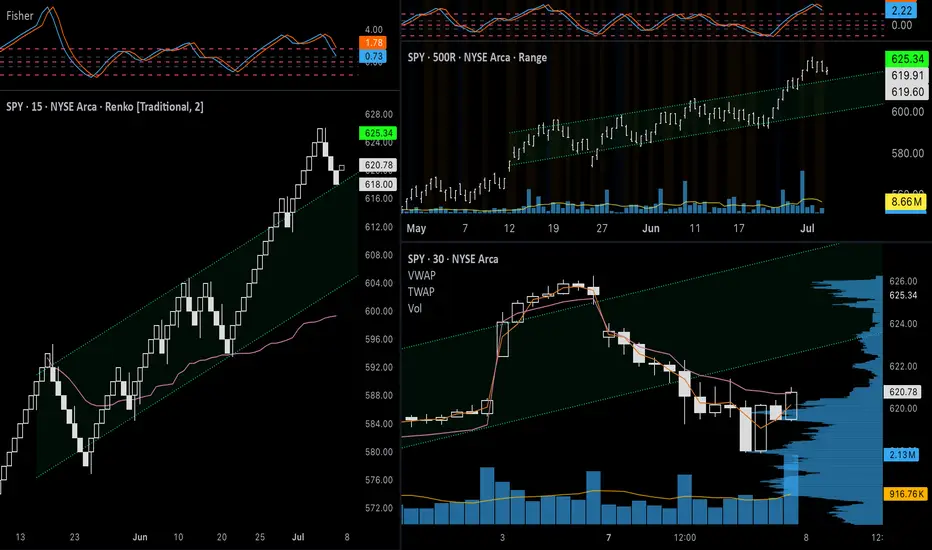
Renko: The price pulled back on Monday, as expected, and may continue lower to retest the top of the channel (around $615). Fisher Transform is still in positive territory and strong support at that level could lead to the price reaching higher highs.
500R ($5) chart: Similar structure to the Renko chart. I’m using a higher range here to compensate for volatility. Just like with the Renko chart, a bounce on the top of the channel would be a healthy pullback before higher highs. There is a high volume node on the volume profile, so interest from buyers here could be strong enough to prevent the price from falling back into the channel.
4h chart: The last three candles have the appearance of a healthy pullback. There was declining volume and
the most recent candle is somewhat of a bullish hammer. I also have an anchored VWAP going back to June 30 that the price seems to be respecting. The price bounced off of it in the first 4h candle on Monday and managed to close above it after a dip during the formation of the second candle.
+++++++++++++++++++++++++++
Bearish Analysis
Renko: Same chart with a lower box size ($1 instead of $2). As you can see, there is bearish divergence on Fisher Transform. The price also found likely temporary support before reaching the top of the channel, suggesting that it could make at least one more wave down if a larger corrective trend unfolds. The 1.382 ($614) and 1.618 ($612) Fibonacci extensions will be important reference points to watch. I would feel less confident about the strength of the bullish trend if the price goes beyond the 1.618 extension.
200R ($2) Range: The Range chart in this layout is the only one that I am including extended hours data on, so the channels have slightly different levels. On this chart I am using two trend lines on the upper level to illustrate the possible areas of support/previous resistance. If the price breaks back into the channel and below the 34VWMA, it could signal a trend failure and the price could return to $600 or lower. Volume bars on range charts also offer a different perspective than on time-based candlesticks. Here, since each bar represents a $2 move up or down, the volume inside of each bar can show the level of effort it took to move the price either direction, whereas the time-based charts are simply showing the level of interest during a particular time period. For this reason, consistently high volume during this last move up could be a sign that there is a larger presence of sellers. Lastly, there is Fisher Transform divergence here as well.
1h chart: CME_MINI:ES1! is green overnight, signaling continuation of the bounce we saw at the end of the day on Monday. With a tighter channel, the top was rejected in a classic bearish reversal candle pattern above the channel and made a clean break down below the channel. The price found support just above the anchored VWAP from the start of the channel, so there could still be institutional interest around $617 and below. If this correction were to unfold into three distinct waves, a 0.618 pullback (to the 0.382 level of the fib extension; $623) would retest the previous demand of the channel. A rejection here could have the price looking for support in a lower volume zone. A (c) wave could take the price down to $615-$611.
+++++++++++++++++++++++++++
Options Analysis
As I have explained, I think it is possible that we will see the price hit $623 during the Tuesday session, so it could be an important level for ATM options. TVC:VIX held its level on Monday after the gap up but failed to make progress - finding resistance at the 200MA on the 1h chart. The rounding bottom and bullish candles on the 30m AMEX:SPY chart looks better than other timeframes. From a Wyckoff Method perspective, however, it looks like puts are in a distribution pattern and calls are in accumulation. Volume is low for both of these contracts, but especially lower on the Put option, indicating lack of interest.
If the put contract makes a lower low on Tuesday (below $3.55 or above $620.75 for SPY), this particular contract could break into a downtrend. Calls seem to be the safer bet since the price has already made a higher high and has wider support. An ideal entry would be a false breakout at $0.95 ($621.00 for SPY) or a retest of the top of the channel after a true upside breakout at $1.50 ($622.50 for SPY) The upside breakout possibility would have stronger confirmation, so it would be worth the higher premium price. This movement would need to be accompanied by high volume, of course.
For puts, I would like to see higher volume at the bottom of the range, since it seems like the underlying price will open higher. I would probably switch to a contract with a lower strike since $623 would be ITM but for the sake of this idea, I would target entry of $623p around $3.65 ($620.75 for SPY).
+++++++++++++++++++++++++++
Targets
Calls: Enter $622.50, Target $628-$630, Stop Loss $621
Puts: Enter: $620.75, Target $615, Stop Loss $621.50
To summarize, I like the risk/reward and volume better for calls, and it fits my original thesis, however if volume increases on puts at these elevated levels, it will be important to get in at a price that minimizes risk exposure to take advantage of a deeper correction.
SPY trade ideas
spy puts on level 610 and 614There some level i would like to meet 610 and 614
Disclaimer- it a opinion

SPY/QQQ Plan Your Trade For 6-30-25 : Gap Potential PatternToday's pattern suggests the SPY will attempt to create a GAP at the open. It looks like the markets may attempt to move higher as the SPY is already nearly 0.35% higher as I type.
Last week was very exciting as we watched the QQQ and the SPY break into new All-Time Highs.
I suspect the markets will continue a bit of a rally into the early Q2 earnings season where retail traders attempt to prepare for the strong technology/innovation/AI earnings data (like last quarter).
I do believe this rally is due for a pullback. I've highlighted this many times in the past. Typically, price does not go straight up or straight down. There are usually multiple pullbacks in a trend.
So, at this point, the markets are BULLISH, but I still want to warn you to stay somewhat cautious of a pullback in the near future (maybe something news-related).
Gold and Silver should start to move higher over the next 5-10+ days, with gold trying to rally back above $3450. I see Gold in a solid FLAGGING formation that is moving closer to the APEX pattern.
Bitcoin is nearing a make-or-break volatility point. I see BTCUSD breaking downward, but it could break into a very volatile phase where it attempts to rally (with the QQQ through earnings), then collapse later in July. We'll see how things play out.
Remember, tomorrow morning I have a doctor's appointment. So I may or may not get a morning video done. FYI.
Get some today.

SPY (S&P500 ETF) - Daily Golden Cross and All-Time-High PriceSPY (S&P500 ETF) price has reached all-time-highs in July 2025, after a SMA Golden Cross printed on the daily chart.
SPY is still in a price uptrend since May 2025, however a higher-low pullback has not occurred for the past two weeks.
Resistance levels: $625, $630, $635, $640.
Support levels: $622, $617, $614, $611.
A significant reversal or bearish candle pattern has not occurred yet on either the daily or weekly charts.
The Stochastic RSI indicator has reached overbought levels, both on the Daily chart and Weekly chart.
Stock market earnings season begins in July 2025, trade deal negotiations and new tariffs are in progress this week. Volatility could increase this month due to these news catalysts.

$SPY Today’s Trading Range and everything in it /// 7.11.25Beautiful start here right at the bottom of the expected move for the day.
Today’s Trading range and everything in it. How are you playing it?

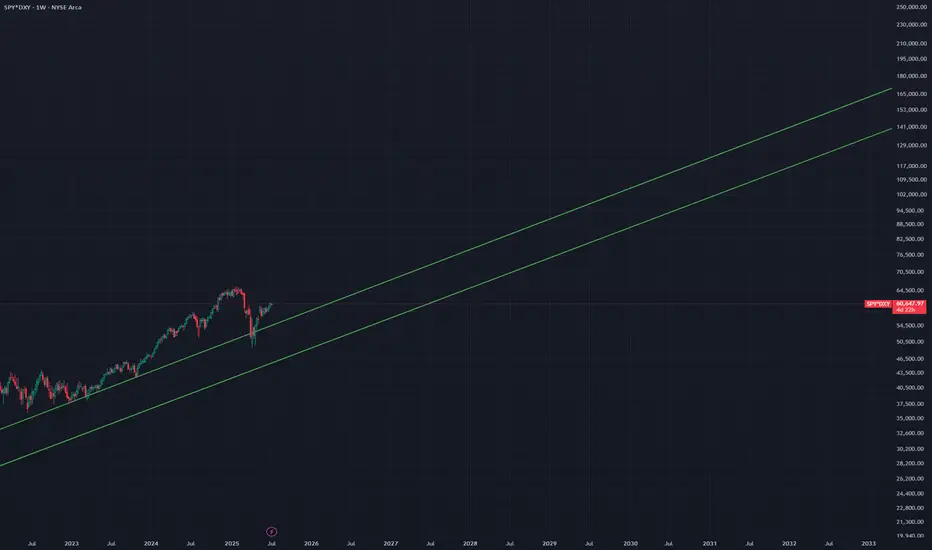
Real SPY vs DevaluationMacro traders and swing traders often employ this type of analysis to comprehend broader economic trends.
Particularly, the inverse correlation between a strong USD and equity markets.
SPRIAL TURN MAJOR JULY 5to the 10th TOP 4 spiral and one FIBThe chart posted is the updated chary for SPY SPIRAL calendar TURN Notice f12 is a spiral from July 16th 2024 top F 10 is from 11/2024 DJI The SPY was 12/5 th TOP F8 is from Feb 19th Top They ALL have a focus point on JULY 5th to 10th 2025 it is also 89 days since the print low. I Am looking for a MAJOR World event into this date . This time I feel it will be something with JAPAN . As to the markets here The put/call is now at the same level as july 2023 top and july 2024 . I have had fib targets in cash sp 500 from 6181 to as high as 6331 we are now in the middle of the targets But Time still has 3 to 5 days .So if we close strong today I will be buying deep in the money puts once again . The QQQ have entered the min target 551/553 But I tend to think {HOPE] we can reach 562 plus or minus 1.5 to move to a full short . But now in cash BTW the SMH target 283/285 is also a target .for its TOP Bitcoin is now setup for the next TOP I just need a new high .Best of trades WAVETIMER

SP500: Wave Estimation via FibsRegularities
Common angle
To estimate where it's heading to we use those recursive patterns and map them through fib scaling. Overall systematic wave expands in similar geometric narrative but with a compressed cycle.

SPY the pattern was there I missed it.THe chart will always show you what it wants to do. You have to see it.

Nightly $SPY / $SPX Scenarios for July 3, 2025🔮 Nightly AMEX:SPY / SP:SPX Scenarios for July 3, 2025 🔮
🌍 Market-Moving News 🌍
📉 U.S. Private Payrolls Surround Weakness
The ADP report showed a drop of 33,000 private-sector jobs in June, the first decline in over two years, reflecting businesses holding back hiring amid trade uncertainty. However, layoffs remain low, signaling no acute stress yet
📊 Markets Braced for NFP Caution
Markets are wary ahead of this morning’s Non‑Farm Payroll (NFP) release—currently projected at +115,000 jobs and 4.3% unemployment—based on indications of labor-market cooling from weak ADP numbers
💵 Canadian Dollar Strengthens
The loonie jumped 0.4% as investors adjust expectations for broader central-bank dovishness, driven by the weak U.S. jobs signals and optimism over a revived U.S.–Canada trade dialogue
📊 Key Data Releases 📊
📅 Thursday, July 3:
8:30 AM ET – Non‑Farm Payrolls (June):
Forecast: +115,000; Previous: +139,000 (May). Watching for signs of sustained job-growth slowdown.
8:30 AM ET – Unemployment Rate:
Forecast: 4.3%, up from 4.2% in May. A rise may increase odds of rate cuts.
8:30 AM ET – Average Hourly Earnings (MoM):
Forecast: +0.3%; prior: +0.4%. Cooling wages would ease inflation pressures.
8:30 AM ET – Initial & Continuing Jobless Claims:
Track week-to-week stability or worsening of labor-market conditions.
9:45 AM ET – Services PMI (June, flash):
Monitor for signs of slowing in U.S. service-sector activity.
10:00 AM ET – ISM Non-Manufacturing PMI (June, flash):
Forecast: 50.8. A reading below 50 suggests contraction in services.
⚠️ Disclaimer:
For informational and educational purposes only. It does not constitute financial advice. Consult a licensed financial advisor before making investment decisions.
📌 #trading #stockmarket #economy #jobs #Fed #labor #technicalanalysis

SPY Stuck at Gamma Ceiling! Will Bulls Break 619 or Get Rejected Again? 🎯
🔍 GEX Option Flow Outlook
SPY is grinding right under the heavy call wall at 619, which aligns with the highest NET GEX resistance zone. The flow is dominated by calls, and GEX is flashing 4 green dots, meaning dealer hedging could drive price higher if 619 breaks cleanly.
* GEX Resistance Wall:
* 🔹 $619–$620 = stacked resistance (Call Wall + GEX7 + GEX8 + GEX9)
* 🚫 Historically acts like a magnet & rejection zone
* GEX Support Wall:
* 🔸 $614 = HVL support (strong bounce zone for 0DTE plays)
* 🔻 $610–$608 = Put Wall danger zone
💡 Based on the current GEX map, if bulls can break above 619 with volume, the path to 623 opens. But failure to do so likely triggers a pullback to 614.
🧠 Smart Money Price Action (1H Chart)
SPY remains in a bullish rising channel, printing higher lows. However, price is stuck inside a CHoCH zone (consolidation under resistance) right under the 619 level.
* BOS from June 27 confirms structure shift
* CHoCH zone holding short-term price action
* 📦 Demand zone: 615–614 → where bulls stepped in before
* Volume dropping = market waiting for catalyst
🎯 Trade Setups:
📈 Bullish Breakout Plan:
* Trigger: Above 619.50 with momentum
* Target: 621 → 623
* Stop: Below 617.50
* Trade Idea: Buy 620C or 622C (0DTE/1DTE) for a quick breakout scalp
📉 Bearish Rejection Plan:
* Trigger: Rejection below 619 with spike in volume
* Target: 614 → 610
* Stop: Above 620
* Trade Idea: Buy 615P or 612P (1–2 DTE) on failed breakout
🧠 My Take:
SPY is at a critical pressure point. If dealers are forced to hedge more delta due to call buying, we could see a breakout. But the Gamma Wall at 619 is real — bulls must break it with force or risk another fade.
Disclaimer: This is not financial advice. For educational purposes only. Always manage your risk. 🎯

How I screen for long term investmentsIn this video, I’ll show you the exact stock screener I use to find long-term investment opportunities — the kind of stocks you can buy and hold for years.
I’ll walk you through the key metrics to look for, how to use free tools like TradingView screener, and what red flags to avoid. This strategy is perfect for beginner and experienced investors who want to build long-term wealth, not chase hype.
Whether you're looking for undervalued stocks, consistent compounders, or just trying to build your long-term portfolio, this screener can help.
Hope you enjoy!!

SP500 approaching rising trendline from belowThere has always been some correction when the market approaches the rising trendline from below. AMEX:SPY has about 10 point and SP:SPX about 100 points to go still. The volume is still on the buy side. I expect that to fade before a correction. Some market leaders like AMZN have already touched that trendline

$SpySo I just wanted to focus on the next 2weeks of trading..
To summarize what I think will happened
We make another high around 620 by End of this week. That high will most likely coincide either the Bill passing through senate or and the Non farm payroll coming out Thursday.
Summer melt up seasonality is in progress.
Historically the week of July 4th trades with really thin volume. Thin volume is hurts bears more than it does bulls. Imagine spy breaking back below 600 with only 50% of its normal volume (Won't happen).
The week after this is the break between this quarter and the next Q3.. this is when I expect a corrective pullback to the 20sma or 605, they'll probably blame it on some Tariff July 9th related catalyst.
2nd week of July begins Q3 and the market will move up or down or earnings. From my experience, you rarely see Armageddon in the market before big tech earnings.
So basically 620 this week at some point , 605 next week and from there Earnings season starts off with big banks.
Some more trading advice I'd give is becareful with too far OTM weekly options, I expect at least 2 of these days will be terribly choppy.
One of the main reasons I believe the market will now go higher is because of the index moves... of course you saw the how spy and Qqq made a V shape recovery, well the Dow jones and IWM are now catching up with their own V
So if the Dow has 2-3% left to pump the Spy will atleast match that pump. This move could come next week or wait until the pullback and finish during earnings but it will come.
I'll do a bigger picture and out look after next week's move.
Some trade ideas I'll post here
First one is NASDAQ:GOOGL
Channel trade here..
I think early in the week googl heads to 181.50. If market melts up later in the week then googl could see 185.00.. but like I said this is a channel trade and the ultimate tgt is 190 ish .
2nd trade
Tsla
I think it's headed back to 300.00 or 200ema
From there we will either bounce and make a Pennant or double top lower .. if you look, you'll see price has been bouncing of its 50sma for 2weeks now, so the short entry is below that
Lastly, there is not enough volume to pump all stocks this week, so some will be red and some will be green.. to avoid longing or shorting the wrong one, have patience and wait 30min-1hour after the open for true direction before you trade ..
Good luck

SPY Rejected at Gamma Wall–Watch $610 Breakdown or $615 Reclaim🧠 GEX-Based Options Sentiment:
SPY closed Friday with a rejection off the Highest Positive Net GEX / Gamma Wall at $615, with sellers defending the upper structure near the 2nd Call Wall at $620.
Support now lies in the $608–$604 range, with $605.54 and $604.45 aligning with GEX magnets and prior structure. Below that, there’s a gap to the HVL zone near $599, and the gamma floor starts deep around $591, which is also defended by the 2nd and 3rd PUT Walls.
Implied Volatility Rank is 12.2, with IVX below average. This implies premium selling could be dominant unless we break key levels. Meanwhile, PUT flow dominates at 31.9%, showing a clear defensive posture by institutions.
🔧 Options Trade Setup (for Monday–Wednesday):
Bearish Setup:
If SPY confirms under $610, especially during the first hour Monday, it could trigger a fade toward $605 or even $599 HVL.
Consider a PUT debit spread like 610p/600p (Jul 3).
Stop out if price reclaims $613.50–$615 cleanly.
Bullish Setup:
If SPY holds $610 and reclaims $615 with force, it can squeeze into the GEX void toward $620–$622.
Consider a CALL debit spread like 615c/620c (Jul 3).
Stop if price breaks back under $610 with volume.
📉 Intraday Technical Breakdown (1H Chart):
We now have back-to-back CHoCHs printed below rising wedge structure, followed by a failed retest at the top. This is a textbook sign of exhaustion. The final BOS and CHoCH from Friday confirmed that buyers lost short-term control.
The current structure is rolling over with lower highs, and SPY is now trading inside a descending micro-channel after rejection at $615.
Volume picked up on the Thursday/Friday rejection, which adds weight to the downside scenario unless we open strong Monday.
📌 Key Levels to Watch:
$617.00 – Upper Gamma ceiling
$615.00 – Gamma Wall & recent supply zone
$613.50 – Mid-level rejection pivot
$610.00 – Structure support now under threat
$608.48 – Intraday gamma magnet
$605.54 / $604.45 – Strong confluence support zone
$599.49 – HVL target zone
$591.90 – Gamma floor if broader selloff triggers
✅ Thoughts and Monday Game Plan:
SPY looks vulnerable under $610 — this is the most important level to watch. If that breaks and holds below in the first 30–60 minutes, we likely fade to $605 or lower.
The ideal trade setup would be to short the retest of $610 from below, or buy PUTs on confirmed weakness into the gamma air pocket. Alternatively, wait for a high-volume reclaim of $615 to trade with the bulls, but until then, the path of least resistance is down.
Macro catalysts are light, but pre-holiday positioning could bring volatility — stay nimble.
Disclaimer:
This analysis is for educational purposes only and not financial advice. Always use proper risk management and trade with a plan.

$SPY Review of 6.30.25Yesterday’s price action was flat near previous ATH’s for the first part of the day and then the second part of the day we had some nice volatility that tapped the top of the implied move at 619 and then pulled back.

SPY Technical Analysis! SELL!
My dear followers,
I analysed this chart on SPY and concluded the following:
The market is trading on 614.85 pivot level.
Bias - Bearish
Technical Indicators: Both Super Trend & Pivot HL indicate a highly probable Bearish continuation.
Target - 586.37
Safe Stop Loss - 631.68
About Used Indicators:
A super-trend indicator is plotted on either above or below the closing price to signal a buy or sell. The indicator changes color, based on whether or not you should be buying. If the super-trend indicator moves below the closing price, the indicator turns green, and it signals an entry point or points to buy.
Disclosure: I am part of Trade Nation's Influencer program and receive a monthly fee for using their TradingView charts in my analysis.
———————————
WISH YOU ALL LUCK

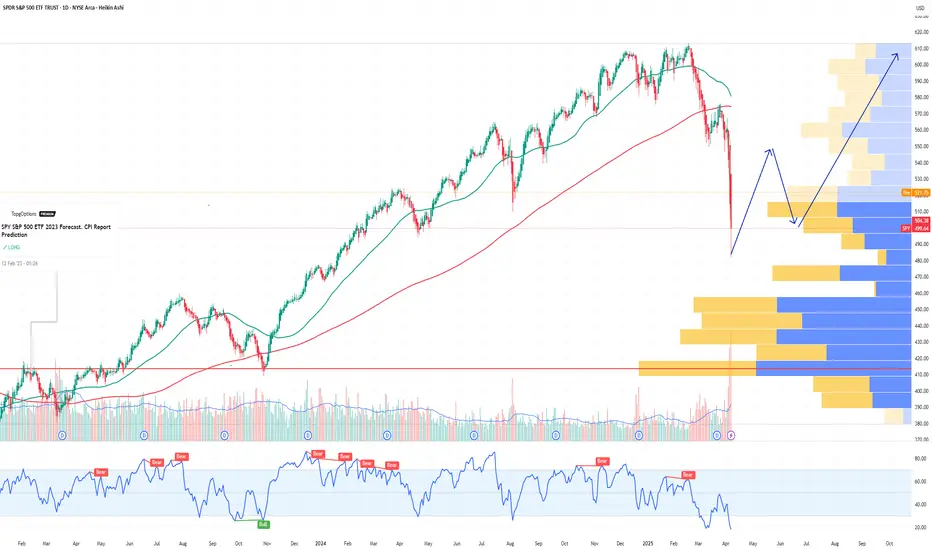
SPY S&P 500 ETF Potential W-Shaped Recovery Forming We may be witnessing the formation of a W-shaped recovery on the SPY (S&P 500 ETF) – a classic double-bottom structure that often signals a strong reversal after a period of correction or volatility. Let’s dive into the technicals and what this could mean in the sessions ahead.
🔍 The Technical Setup:
SPY recently tested key support around the $485-$500 zone, bouncing off that area twice in the past few weeks. This gives us the left leg of the W and the first bottom. After a modest relief rally to ~$520, we saw another pullback – but this second dip failed to break below the first bottom, a hallmark of the W-pattern.
As of today, SPY is starting to reclaim ground toward the $517-$520 resistance zone. If bulls can push through this neckline area, especially with volume confirmation, we could see a breakout that targets the $530-$535 area in the short term.
🔑 Key Levels to Watch:
Support: $490-$500 (double-bottom support zone)
Neckline/Resistance: $530
Breakout Target: $550 (previous highs)
Invalidation: A break below $490 with volume could invalidate the W-recovery idea and shift bias bearish.
📊 Momentum & Volume:
RSI is climbing back above the 50 level – bullish momentum building.
MACD shows a potential crossover forming, hinting at a shift in trend.
Watch for increasing buy volume as SPY approaches the neckline – that’s where the bulls will need to step up.
🧠 Macro & Earnings Angle:
Don’t forget – we’re entering a heavy earnings season and rate cut expectations are still a wildcard. A dovish tone from the Fed and strong corporate results could be the fuel that sends SPY higher to complete this W-shaped recovery.
🧭 Final Thoughts:
This is a high-probability setup if neckline resistance is broken cleanly. Wait for confirmation before going heavy – fakeouts are common in double-bottom scenarios. If we do get the breakout, we may be looking at a broader market rebound going into summer.
🔔 Set alerts near $525. A confirmed breakout could mean the bulls are back in charge.
Market BreadthMarkets are still in 'Bull' mode going into the 4th. Keeping a eye on the 9-EMA which I use as a trailing stop on my long positions. Not likely to pick up any new positions for now.

Weekly $SPY / $SPX Scenarios for June 30 – July 3, 2025🔮 Weekly AMEX:SPY / SP:SPX Scenarios for June 30 – July 3, 2025 🔮
🌍 Market-Moving News 🌍
📈 US Stocks Rally to Record Highs
Following a volatile first half, U.S. equities surged into record territory in late June on a combination of easing Middle East tensions, cooling inflation data, and the 90-day tariff pause
💵 Dollar Weakens on Fed and Trade Uncertainty
The U.S. dollar fell to a 3½-year low, pressured by persistent speculations over President Trump replacing Fed Chair Powell and extending rate-cut expectations, as well as progress in U.S.-Canada trade talks
🇨🇦 U.S.–Canada Trade Talks Lift Sentiment
Canada temporarily repealed its digital services tax to facilitate talks seeking a broader trade agreement by July 21, boosting U.S. equity futures
🛢️ Oil Prices Stabilize
After spiking on geopolitical fears, oil traders settled between $65–78/bbl amid supply relief following ceasefire developments and easing Middle East risks
⚠️ July Risks Loom
The coming week will spotlight:
July 4 deadline for Trump’s tax bill
Expiry of the tariff pause on July 9
U.S. Nonfarm Payrolls on July 3
Each poses potential for increased volatility if outcomes disappoint
📊 Key Data Releases & Events 📊
📅 Monday, June 30
9:45 AM ET – Chicago PMI (June): Gauge of Midwestern factory activity
📅 Tuesday, July 1
U.S. markets open, watch trade developments
📅 Wednesday, July 2
Global PMI readings released
📅 Thursday, July 3 (Early close ahead of Independence Day)
8:30 AM ET – Nonfarm Payrolls (June)
8:30 AM ET – Unemployment Rate (June)
8:30 AM ET – Average Hourly Earnings (June)
These labor metrics will be critical for Fed rate outlooking
⚠️ Disclaimer:
This information is for educational and informational purposes only and should not be construed as financial advice. Always consult a licensed financial advisor before making investment decisions.
📌 #trading #stockmarket #economy #jobs #Fed #oil #trade #technicalanalysis

SPY: Bearish Continuation is Expected! Here is Why:
Looking at the chart of SPY right now we are seeing some interesting price action on the lower timeframes. Thus a local move down seems to be quite likely.
Disclosure: I am part of Trade Nation's Influencer program and receive a monthly fee for using their TradingView charts in my analysis.
❤️ Please, support our work with like & comment! ❤️

Friday afternoon UpdateSPX looks like it's consolidating only. Gold has broken above resistance. OIL and Nat Gas looks like they want to go higher. BTC should go higher, but not too much more.

Multi Market Update 7-9-2025SPY likely put in a C wave this morning, I expect a further move down for the rest of the week. Gold starting to look bullish again. Natural Gas likely keeps dropping towards 2.5. BTC at the top of it's range. USOIL is at resistance. The stock I'm trading - aapl - is showing a bear flag on small time frames
