$SSV/USDT has broken out$SSV/USDT has broken out of a key ascending triangle on the daily chart, clearing resistance around $11.90 with strong momentum.
The breakout targets an 84% potential upside toward the $21+ zone.
As long as it holds above the breakout level, the trend remains bullish with further gains likely.
Watch for a retest for possible entry.
DYRO, NFA
SSVUSDT trade ideas

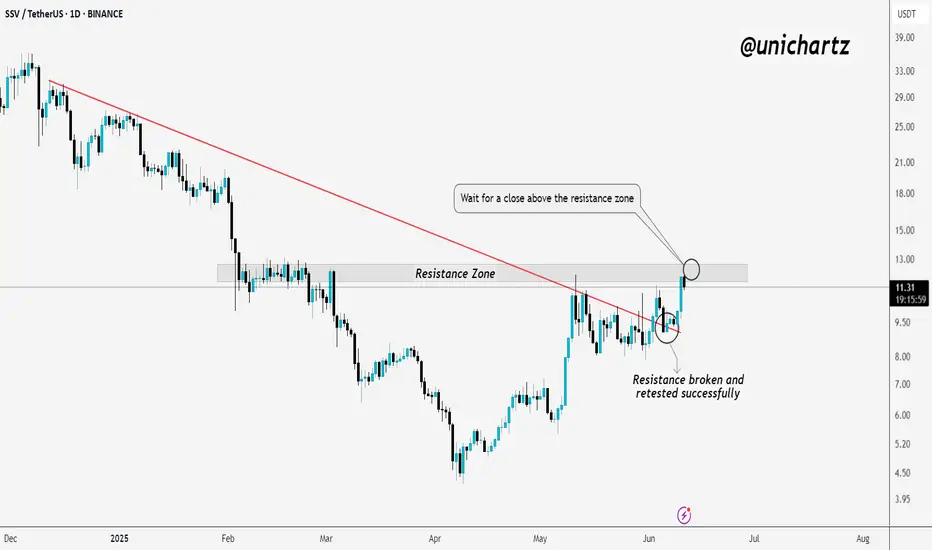
SSV | Bullish Market Structure Shift in PlayTSXV:SSV is showing strong bullish momentum. The key resistance line has been broken and successfully retested, confirming a shift in market structure.
Now, price is testing the major resistance zone. For further upside confirmation, it's important to wait for a clear daily close above this resistance zone.
If the breakout holds, this could open the door for the next leg higher. One to keep on your watchlist.
DYOR, NFA
SSV/USDTKey Level Zone: 8.000 - 8.700
HMT v8.1 detected. The setup looks promising, supported by a previous upward/downward trend with increasing volume and momentum, presenting an excellent reward-to-risk opportunity.
HMT (High Momentum Trending):
HMT is based on trend, momentum, volume, and market structure across multiple timeframes. It highlights setups with strong potential for upward movement and higher rewards.
Whenever I spot a signal for my own trading, I’ll share it. Please note that conducting a comprehensive analysis on a single timeframe chart can be quite challenging and sometimes confusing. I appreciate your understanding of the effort involved.
Important Note :
Role of Key Levels:
- These zones are critical for analyzing price trends. If the key level zone holds, the price may continue trending in the expected direction. However, momentum may increase or decrease based on subsequent patterns.
- Breakouts: If the key level zone breaks, it signals a stop-out. For reversal traders, this presents an opportunity to consider switching direction, as the price often retests these zones, which may act as strong support-turned-resistance (or vice versa).
My Trading Rules
Risk Management
- Maximum risk per trade: 2.5%.
- Leverage: 5x.
Exit Strategy
Profit-Taking:
- Sell at least 70% on the 3rd wave up (LTF Wave 5).
- Typically, sell 50% during a high-volume spike.
- Adjust stop-loss to breakeven once the trade achieves a 1.5:1 reward-to-risk ratio.
- If the market shows signs of losing momentum or divergence, ill will exit at breakeven.
The market is highly dynamic and constantly changing. HMT signals and target profit (TP) levels are based on the current price and movement, but market conditions can shift instantly, so it is crucial to remain adaptable and follow the market's movement.
If you find this signal/analysis meaningful, kindly like and share it.
Thank you for your support~
Sharing this with love!
HMT v2.0:
- Major update to the Momentum indicator
- Reduced false signals from inaccurate momentum detection
- New screener with improved accuracy and fewer signals
HMT v3.0:
- Added liquidity factor to enhance trend continuation
- Improved potential for momentum-based plays
- Increased winning probability by reducing entries during peaks
HMT v3.1:
- Enhanced entry confirmation for improved reward-to-risk ratios
HMT v4.0:
- Incorporated buying and selling pressure in lower timeframes to enhance the probability of trending moves while optimizing entry timing and scaling
HMT v4.1:
- Enhanced take-profit (TP) target by incorporating market structure analysis
HMT v5 :
Date: 23/01/2025
- Refined wave analysis for trending conditions
- Incorporated lower timeframe (LTF) momentum to strengthen trend reliability
- Re-aligned and re-balanced entry conditions for improved accuracy
HMT v6 :
Date : 15/02/2025
- Integrated strong accumulation activity into in-depth wave analysis
HMT v7 :
Date : 20/03/2025
- Refined wave analysis along with accumulation and market sentiment
HMT v8 :
Date : 16/04/2025
- Fully restructured strategy logic
HMT v8.1 :
Date : 18/04/2025
- Refined Take Profit (TP) logic to be more conservative for improved win consistency

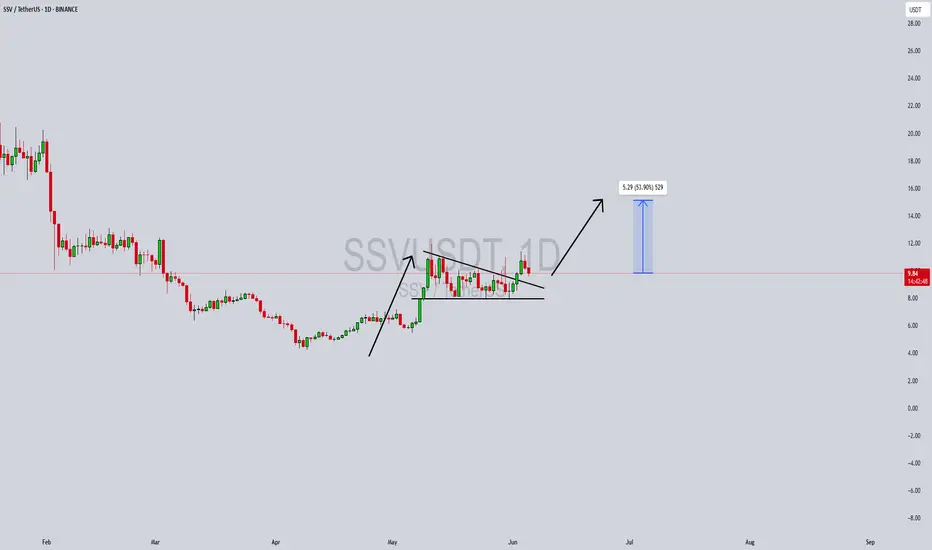
SSVUSDT Forming a Bullish PennantSSVUSDT is currently forming a bullish pennant pattern, which is typically a continuation formation that appears after a strong upward impulse. The pair recently experienced a significant breakout to the upside, followed by a consolidation phase forming a symmetrical triangle or pennant structure. With good volume maintaining support and bulls defending key levels, this setup is signaling that a strong breakout could be imminent.
SSV Network (SSV) plays a vital role in the Ethereum ecosystem by enabling decentralized staking infrastructure. As Ethereum’s staking market continues to grow, projects like SSV are drawing significant interest from investors due to their utility and real-world staking applications. With more ETH validators looking for secure and decentralized staking solutions, SSV is well-positioned for organic growth in the coming months.
The technicals support the bullish bias, with the chart projecting a potential 40% to 50% gain once price breaks out from the current consolidation zone. The bullish momentum building over the last few weeks, combined with strong investor sentiment and healthy volume, adds confidence to this projection. The breakout target aligns with prior resistance zones, making this a high-conviction setup for swing traders.
This pattern, in conjunction with the underlying fundamental strength of the SSV protocol, presents a compelling opportunity for traders watching altcoins with real utility. A successful breakout could attract more retail and institutional attention, especially as staking continues to trend in the broader crypto narrative.
✅ Show your support by hitting the like button and
✅ Leaving a comment below! (What is You opinion about this Coin)
Your feedback and engagement keep me inspired to share more insightful market analysis with you!
$SSV BREAKOUT CONFIRMED !!TSXV:SSV BREAKOUT CONFIRMED 🚀
Massive breakout from the long-term range on the 6H chart!
SSV smashed above resistance potential 100 %+ upside in play
Retweet if you are bullish!
DYOR, NFA
#SSV #ALTSEASON

Crypto Market Update for week 1 June 2025In this video I have given detailed market update analyzing BTC, ETH and other major coins with Buying and Sell levels that we may expect in the following 2 months.

Watch $SSV Closely – Big Move Ahead if Resistance Breaks#SSVUSDT Falling Wedge on 6H
The pattern is still holding strong! Price is coiling tighter inside the wedge.
A breakout above resistance could trigger a sharp 50%+ move to the upside. Eyes on $13+ 🚀
Setup looks promising — watch closely!

SSVUSDTmy entry on this trade idea is taken from a point of interest below an inducement (X).. I extended my stoploss area to cover for the whole swing as price can target the liquidity there before going as I anticipate.. just a trade idea, not financial advise
Entry; $8.232
Take Profit; $9.016
Stop Loss; $7.980

Trading opportunity for SSVUSDTBased on technical factors there is a Sell position in :
📊 SSVUSDT
🔴 Sell Now
🪫Stop loss 8.37
🔋Target 6.85
📏 R/R 2
💸RISK : 1%
We hope it is profitable for you ❤️
Please support our activity with your likes👍 and comments📝

SSV Holds Key Support: Bullish Reversal on the Horizon?TSXV:SSV is holding above a key horizontal support zone, hinting at a potential bullish reversal if this level remains intact.
Support: Strong demand zone acting as a base, preventing further downside.
Breakout Watch: A bounce here could trigger a breakout above the descending trendline, targeting the $25–$30 region.
RSI: Currently in the oversold zone, signaling weakening selling pressure and a possible reversal.
Look for bullish confirmation around support. A bounce may signal an upward trend, while a breakdown could lead to lower levels.
#SSV #Crypto

Trading opportunity for SSVUSDTBased on technical factors there is a Buy position in :
📊 SSVUSDT
🔵 Buy Now
🪫Stop loss 11.90
🔋Target 15.10
📏 R/R 1,6
💸RISK : 1%
We hope it is profitable for you ❤️
Please support our activity with your likes👍 and comments📝

SSV/USDTKey Level Zone : 24.50-24.80
HMT v3.0 detected. The setup looks promising, supported by a previous upward/downward trend with increasing volume and momentum, presenting an excellent reward-to-risk opportunity.
HMT (High Momentum Trending):
HMT is based on trend, momentum, volume, and market structure across multiple timeframes. It highlights setups with strong potential for upward movement and higher rewards.
Whenever I spot a signal for my own trading, I’ll share it. Please note that conducting a comprehensive analysis on a single timeframe chart can be quite challenging and sometimes confusing. I appreciate your understanding of the effort involved.
If you find this signal/analysis meaningful, kindly like and share it.
Thank you for your support~
Sharing this with love!
HMT v2.0:
- Major update to the Momentum indicator
- Reduced false signals from inaccurate momentum detection
- New screener with improved accuracy and fewer signals
HMT v3.0:
- Added liquidity factor to enhance trend continuation
- Improved potential for momentum-based plays
- Increased winning probability by reducing entries during peaks

$SSVIf SSV holds 25 dollars and breaks the 27.50-28$ resistance, 28$ will be the next crucial support. Then around 31$ would be the first target before a pullback to 25 dollars and then 40$ will be in reach. Im bullish on SSV.

Trading opportunity for SSVUSDTBased on technical factors there is a Buy position in :
📊 SSVUSDT
🔵 Buy Now
🪫Stop loss 21.50
🔋Target 26.70
📏 R/R 1.2
💸RISK : 1%
We hope it is profitable for you ❤️
Please support our activity with your likes👍 and comments📝

$SSV is a Hidden gem!It's a good opportunity to buy rn and sell and that point I have specified. then wait to buy again. That would be +400% mid 2025 and 100% this bull run.
Anyways do you own research but everything is looking good chart side :]

Easy way for $SSVHey all, long time no see market is good and i'm looking for at least 100% in this coin. i will update the chart once big move happen see u later.


#SSV/USDT breaks the Diagonal Trendline in 4-Hour TF!#SSV/USDT breaks the Diagonal Trendline in 4-Hour TF!
Wait for retest to long $SSV. The local resistance level is PMH $33.83 and the local support level is PWL $28.86.

SSVUSDTWe can attempt to buy SSVUSDT from specified level as it make double bottom , also bullish divergence occur indicate that it moves upward.
SL , TP mention in chart

SSV USDT longA long scalp trade on SSV/USDT could be favorable if the price holds above key support levels and shows increasing buying pressure on lower timeframes. Look for a breakout above immediate resistance with strong volume confirmation to target quick gains while maintaining tight stop-losses to manage risk.

SSVUSDT Nears Channel Breakout: Bullish Move Ahead!SSVUSDT Technical analysis update
SSVUSDT has been trading within a channel for the past 115 days. The price is now moving toward the channel's resistance, signaling a potential breakout. Currently, the price is trading above the 100 EMA on the daily chart, with high volume observed in recent days. Once the channel breakout is confirmed, a strong bullish move can be expected in SSV.

SSVUSDTmy entry on this trade idea is taken from a point of interest BELOW an inducement.. I extended my stoploss area to cover for the whole swing as price can target the liquidity there before going as i anticipate.. just a trade idea, not financial advise

SSVUSDTHMT v1.0 spotted. Looking good with previous wave up with increasing volume and momentum.
- BOS (Breaks of Structure) at @ 19.32-19.61 level
- Trending slow and steady if able to hold above the BOS level
It is at extremely good reward to risk level.
