STEEM / BTCSTEEM / BTC
The price breakdown of the resistance level, which became after that the support level, and fixing above it indicates the possibility of the price hike higher after a local return to it and a rebound
Entry price 0,000147
TP1 0.000161
TP2 0.000172
TP3 0.00018
Stop Loss 0.00011
Transferring to breakeven after 0.00017
STEEMBTC trade ideas

STEEM-BTC Long Trade PlanCommodity : STEEM
Trade Type : LONG
Trading Against : BITCOIN
Entries : Double-UP Entries throughout the Buy Zone
Profit Taking : 25% at each TP point
Profit Locking : Move SL to break even once TP1 is hit, to TP1 once TP2 hits, to TP2 once TP3 hits and so on
Duration - 1-4 weeks
Investment in trade : 5% of the total Trading Balance.
Prospective Profit : 14% to 46%
Prospective Loss : 9%
RRR : SL to TP1 is 1.5, SL to TP2 is 2.6 , SL to TP3 is 3.7 and SL to TP4 is 4.8
Buy Zone/TPs/SL price points are marked in the chart as follows
Greens - Profit Targets (TPs)
Blue - Buy Zone (Entries)
Red - Stop Loss (SL)


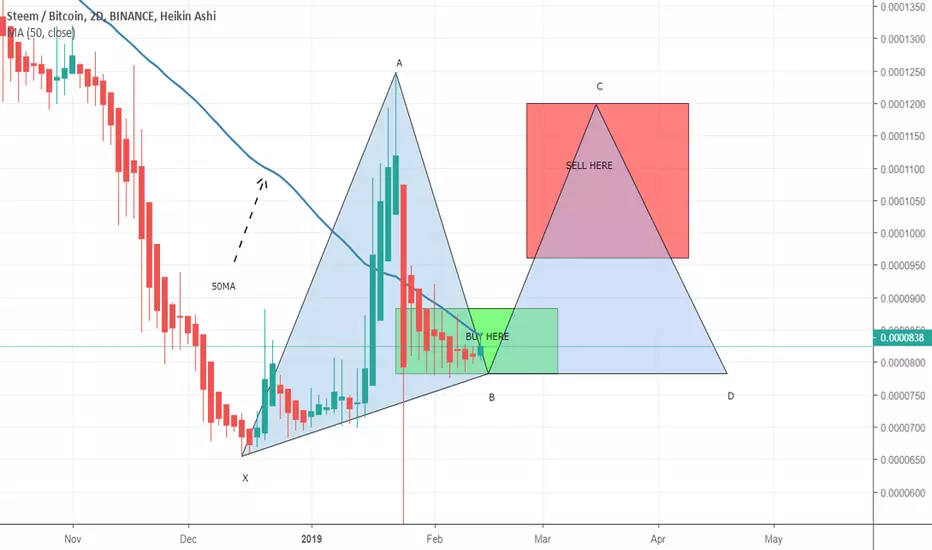
STEEMBTC gearing up soonThe extreme sell of on 25 jan could not stop the price action to gear up again, it was due to the some exceptional situation with steem and more than that the bad press played an important role.
Now I am expecting a bullish gartley or butterfly formation insha Allah.
Here we have a 50MA to push the price line back to bull move.
Regards,
Atif Akbar (MOON333)


Steem / BTC - Midterm OutlookSTEEM / BTC is of interest.
Price recently broke from a HTF Supply block.
- As of now we have heavy sell pressure via our HTF wicks.
- Price is forming Higher Lows
Projection for STEEM given within the chart if price is able to break above this Demand Range.
Cheers

My earlier chat on SteemSteem broke out eventually, though i sold too early when btc's volatilty made my stop-loss to trigger
Like ~ Comment ~ Follow


STEEM/BTC 1DSteem on the resistance line, be care.. Soon golden cross.
Good luck!
***
Green line: MA50
Red line: MA200
Grey line: EMA200

SteemBTCSteem trade possible due to a confirmed close above a pivotal resistance position. Looking to target a couple of important daily levels.

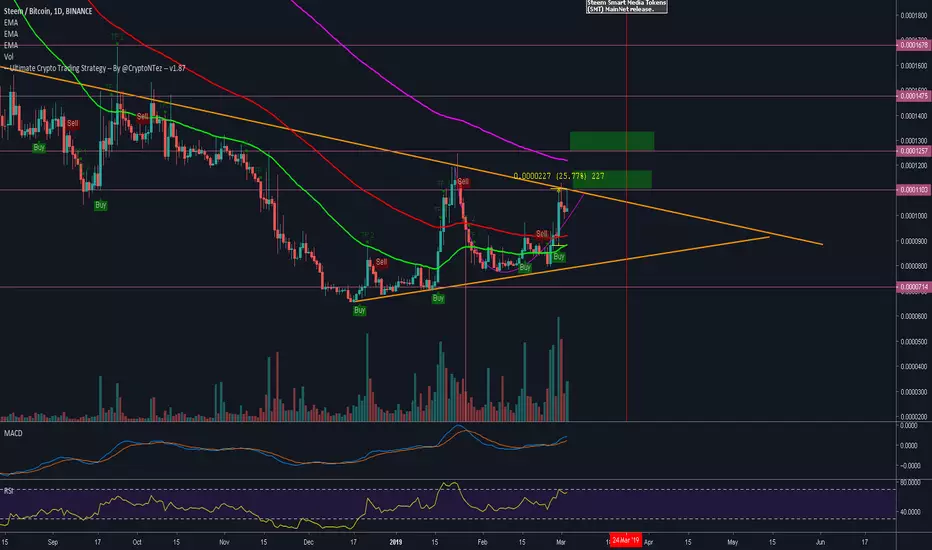
STEEM/BTC-Long setupSteem is a cryptocurrency token that has utility on the Steemit platform – an incentivized blockchain-based social media platform founded by Dan Larimer, who is also the founder of BitShares.
STEEM will be launching their MainNet on 24th March'2019 after the TestNet was released in the month of January'2019.
It might affect steem price analysis so let's analyze the Daily Timeframe chart of the pair to know levels to buy for upside potential and one of the best performing coins now.
STEEM/BTC pair has already seen a surge of 100%+ in December month and 50%+ in the month of February 2019.
There is a more potential upside for the pair with the upcoming catalyst (MainNet).
If the Pair breaks the preliminary resistance around 0.0001168-0.0001260 Satoshi, then one buy at these levels after the retest.
If the resistance is not broken then we can see the price reaching support level 0.0000900-0.0000835 satoshi where interested buyers can look for these levels to enter for safe entry.
If the 0.0000900-0.0000835 satoshi level is not respected then one can look for buying around 0.0000645-0.0000667 satoshi level with a tight stop-loss. Sellers can look for two potential resistance zone around 0.0001800-0.0002000 satoshi to book profits.
Also, it has been trading above the 200D-SMAs and Ichimoku cloud, which is slightly bullish.
Caution: If the last line of support 0.0000645-0.0000667 satoshi level is broken then one should not hold the coin as it would be strongly bearish for the asset.

STEEMBTC - ANOTHER PATTERN Buy Price: Green Zone
TP: Blue Zone
Support: Orange Line
Resistance: Purple Line
SL: Red Zone (I don't recommend to sell in loss.)
Invest Suggestion: 20 Percent
Profit Expectations: 10 to 40%
Another pattern founded in STEEM, it's seems very likely to happen again ( borwn circle )! All techinicalls are pretty good!
See me previous analysis and how profitable the are!!!
Sell when you get some profit, according the way you trade.
Keep following us and please like this idea.
Any doubts? Send in the comments or in our telegram or Inbox here.
Thanks for visiting.


Steem long term tradeSTEEM is a coin i have traded successfully over the years. I see a bigger cycle playing out and a good chance to make some profits over a longer play. Right now is not the time to buy however ill be looking for a pullback to get an entry and let the full cycle play out. If no pull pack ill look for the 4the wave retrace and look for a 5th wave entry. One to watch


SMT Mainnet coming on March 24th$Steem March 24 is the release date of the SMT Mainnet, while I don't think this is a big catalyst. I would expect some action. Currently symmetrical triangle in play, I would expect it to test upper trendline in the following days. Targets on the chart #Steem
Update on $STEEM. Forecast worked flawlesly. First target already met and we are 20 days from the SMT Mainnet Release. Over 25% in profit. I will lock some profits here and see if price retraces or keeps running up. Both MACD & RSI are bullish. Volume looks strong for now #STEEM
actualizacion 12 dias despues *no es una recomendacion STEEM/BTCrespetando una linea de tendencia al alza, estamos en ganancias y si perdemos la linea de soporte dependiendo del mercado, es probable que debamos salir pronto puesto que nos acercamos mucho a una resistencia, sin el soporte, habra que salir y esperar otra oportunidad de momento hay que continuar con el trade.

#BUY STEEMPositive news coming out for STEEM. Mainnet launch due date is 24th March. Price is hovering on resistance (S/R flip). If it breaks,first target will be 0.0001515. However with this bullish news coming along the way, chart looks great, I believe price could easily get to TP1.

STEEMBTC Long to Mainnetcrypto bullish bias, mainnet fomo, FA, TA, volume, trending
mind btc action and watching for and quick drops; use trailing stop to secure profits
