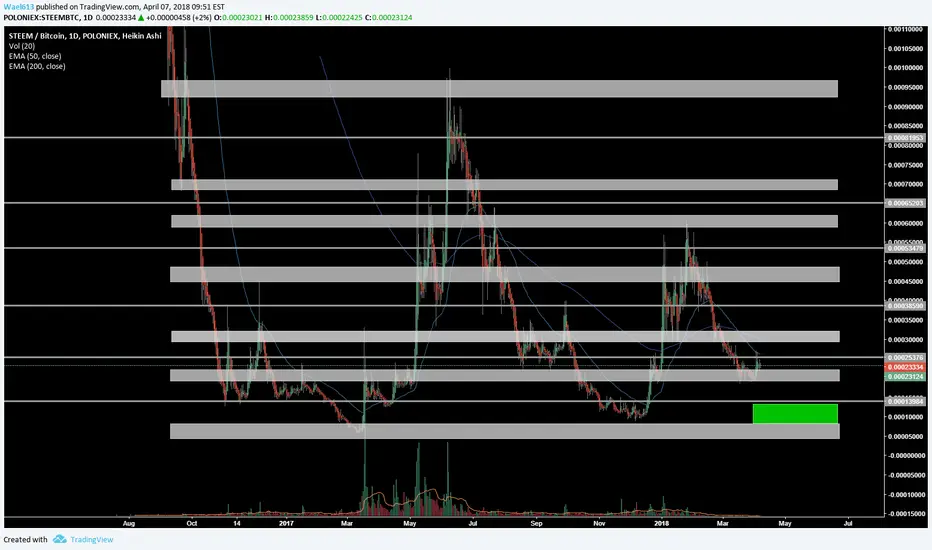
Long term cycle or too ideal?Cyclic convergence with good support?
I think it is too obvious, but the patterns are eye candy none the less.
STEEMBTC trade ideas

Steem for 100% trade.Hello Friends
We had the sell call on Steem, a few days back. You have saved money on it almost 50-60%. Here is the link
Now, we are revisiting the STEEM, May be we are trying to catch the bottom :)
My conditions are
1) Price is on the support
2) Forming a flag pattern
3) RSI in oversold
4) Price above MA 5
6) MACD crossover
7) Lows are getting closer
The above reasons convince me to take a risk, So I would Buy. My Buy zone is
0.00024500 - 0.00027500
Target : 0.00055000 (100-110%)
Sl : 0.00023000 (5%)
Note:
1) BTC fall can impact the market sentiment and can impact alt price. So keep a watch of the prices and exit on sl hit.
2) No need to wait for the exact Target. You can exit if you feel the market is not in favor. Price below 5 MA is the first sign of negative.
Good luck friends.
Check my Signature for the Telegram information.

Steem Breakout - Up to 200% Potential ProfitsSteem Breakout - Up to 200% Potential Profits
Buy
0.00024000 - 0.00025000
Short Term Targets
Targets 1 : 0.00028000
Targets 2 : 0.00032000
Targets 3 : 0.00037000
Mid Term Targets
Targets 1 : 0.00042000
Targets 2 : 0.00047000
Targets 3 : 0.00052000
Long Term Targets
Targets 1 : 0.00060000
Targets 2 : 0.00080000
Targets 3 : 0.00090000
Stop Lose : 0.00019000
Good Luck

SteemI see steem going to 7000-13000 sats, I know its a big difference in between but just accumulate at that price and wait for the next market cycle and sell at the top!!
Buy before the crowd does and sell before they do. The sheep always buy coins when they have 10-100x already. Find the accumulation coins and stack up when time is ready. Be patient .

STEEM GOES NUCLEAROn the very support.
Gained 50% in 2h chart 2 days ago.
MACD 4h/daily crossover in the very front of entire market.
Predominated 12/26 on 1 day chart from January.
Potential is huge and its highly volatile coin.
Gaining 50% of value (2200sats to 3400says) and stayin in " upper chanel" (above 2500 sats, rebouncing and gradually building price).
Falling wedge from January.


Buy SteemSignal for BINANCE:STEEMBTC
SL: NONE (will follow up on it)
Buy @ 0.0002200
TP: 0.0002700 (22.7%)
Order with TP trailing of 7%
Risk per trade: 1%
To place take profit (TP), stop loss (SL) and Trailing I use 3commas services. Register and get 10$ on your trading account.

Steem Price MovementSteem has been on a roller coaster since it's release. It's seemed to have formed a nice symmetrical triangle which is a nice but signal for short term gains.
If the candles remain tight over the next day, expect a nice pump in the price coming up to previous resistance levels. Potential for nice short term 10% gains, with a 4-5% stop loss to prevent against FUD.

Are you in on STEEM??On my one day chart, STEEM has been holding above a long-term support line below the .382 on my fib extension. Remaining in the green channel of my pitchfork for the better part of the last 2 months this coin looks set to see a possible 10-20 percent rise within the next month with potential to rise significantly beyond that if it breaks resistance.
Zooming into the four-hour chart the MACD seems about to cross over the centerline reacting well with my pitch fan. Looking at the RSI in the same time frame it seems to be about to bounce from resistance keeping it out of overbought territory. For the last few weeks, the RSI has remained above 25, another indicator that STEEM remains in bullish territory for now.

STEEM for Easy 30% Profit #Trade128 #STEEM
Buy Under 0.000225
#SaleTargets
Target 1: 0.000242
Target 2: 0.000264
Target 3: 0.000287
Target 4: Wait for Dip and Followup
StopLoss 0.00020300
Risk 5% / Reward 30%
** Strategy: ** Must use #MultiTargets Strategy. Sale 1/3 On each Target and rebuy at dip.

Dragonfly dojia "dragonfly" doji depicts a day on which prices opened
at a high, sold off, and then returned to the opening price. In
my experience, dragonflies are fairly infrequent. When they do
occur, however, they often resolve bullishly (provided the stock
is not already overbought as shown by Bollinger bands and
indicators such as stochastics). Here's an example of a
dragonfly doji:
When assessing a doji, always take careful notice of where the
doji occurs. If the security you're examining is still in the early
stages of an uptrend or downtrend, then it is unlikely that the
doji will mark a top. If you notice a short-term bullish moving
average crossover, such as the four-day moving average
heading above the nine-day, then it is likely that the doji marks
a pause, and not a peak. Similarly, if the doji occurs in the
middle of a Bollinger band, then it is likely to signify a pause
rather than a reversal of the trend.
As significant as the doji is, one should not take action on the
doji alone. Always wait for the next candlestick to take trading
action. That does not necessarily mean, however, that you
need to wait the entire next day. A large gap down, after a doji
that climaxed a sustained uptrend, should normally provide a
safe shorting opportunity. The best entry time for a short trade
would be early in the day after the doji.
*DISCLAIMER*:
I am not a financial advisor nor am I giving financial advice.
I am sharing my biased opinion based on speculation.
You should not take my opinion as financial advice.
You should always do your research before making any investment.
You should also understand the risks of investing. This is all speculative based investing.

STEEM 65.26% potential gains in 21 daysFibonacci retracement level .236 lines right up with the prior support before the crash it had. Don't dump your STEEM rewards save them because look at the white arrow on the MACD... Is that possibly a sign of reversal?

March 3rd, SteemBTC, LongI can't say how far it should go up because of this divergence, but the first Fib retracement level would be a safe bet. It's an easy 25% profit.
Enjoy.
Peyman.

STEEMBTC Trend reversalTaking into account all technical indicators and fundamental basis we conclude that the price should dip a bit more closer to the Fib 0.618 support level. Then there should be a trend reversal and a good short and mid term growth. Overall global correction of STEEM price is about to finish.

descending wedgeHello!
Please immediately take into account, this is only my own opinion!
At this site, we see a descending wedge, this is a fairly rare figure - a figure of a fracture of the trend.
We see the dying volume of trades during the formation of the figure, this indicates that the number of players who act in the direction of the previous trend is decreasing.
The breakdown of the wedge line of the figure should be accompanied by high volumes of trades, or by a significant increase in them.
We hope - at the breakdown of the resistance level and the subsequent growth.
The possibility of buying at:
1. Breakdown of the resistance level (upper red border)
1 option can only be considered after - the principle of level duality (the former resistance levels become support levels and vice versa), in this case can fly without retest of the support level.

STEEMBTCOn the 1-Day time frame we have a very optimistic scenario which indicates a growth in this month. The asset skyrocket in June and was in descending channel till the end of December. When it found the support the price went up in 5 Elliott wave pattern this was followed by Elliot ABC correction wave and stopped at Fib 1 support level around 0.000399. Oscillators and moving averages indicate further growth and we expect increase of the price till the Fib 0.618 level. The signal is already in the Premium channel

Steem-BTC - Testing Serious support zone We could have a nice bull flag forming on steem right now, now currently testing serious support. Any change from the lines will be a direction signal. Possible is correction to second support zone.

STEEMBTC - Is Steem Moving in Repeatable Patterns?I might be drawing a long bow here but I'm looking for good news. Is Steem moving in repeatable patterns over consistent time periods or "share stages"? Is there an upward trending symmetrical triangle forming? Am I dreaming of bygone era of bullish crypto trading?
I'll be monitoring for the next couple of days to see if it continues to trade within the triangle. If so I will set a buy-in and some targets.

Would I buy STEEM now? I may not. Why?Hello Friends,
Here is the analysis of Steem, get to know the best analysis from Maheswar.
Looking at the daily chart, we can see the formation of rising wedge and Giant triangle. The price is moving very well in the wedge and it suggests that price can break downside on the corner of the wedge to the target of the support. Well, it would take its own course of time.
Note : Entire analysis would go invalid when the price breaks the wedge/triangle upside decisively.
The price could move to the 0.0062000 levels and fall towards the support: 0.00012600. We have good resistance at 0.0062000 because of the Triangle and Rising wedge resistance.
So I would not enter trade STEEM or stay away for sometime.
$bitcoin $BITCOIN $XDN $XEM $ADA $ICX $TRON $TRX $XEL $EXP $ETC $SC $STEEM

World busiest blockchain STEEM Listed on Binance today 1st FebFebruary greets us with a great news as the world's first, fastest and busiest social media blockchain is now listed on one of the biggest cryptocurrency exchange Asia.
I personally believe this will have a positive impact on the price of STEEM. Wise traders and holders will use this opportunity to buy into STEEM and be the first to get at an affordable price which i just did some minutes ago on Bitshares DEX and Binance. My projection for STEEM is $100 for 3 main reasons.
1. It is the busiest blockchain in the world
2. The price is still at the bottom of the Chart even at the current price of $5+ as seen on Fig 2. although i bought at $0.94
3. It becoming more popular as we are beginning spread the word to unaware users
Be the part of a revolutionised internet called the "Blockchain"
looking at the chart below on tradingview.
STEEM/BTC
Bottom price: 9940sat
Current price: 51665sat ( approximately $5)
Target price: 90484sat
2018 is a year of many opportunity for all crypto enthusiasts.
do not be (POOR) Passing Over Opportunities Repeated. take the opportunity to be RICH.
the STEEM POWER (SP) is in your hand. Use it wisely.
Fig 1 is a smaller cup while Fig 2 shows a bigger cup indicating how undervalued STEEM is at time of writing.
have a happy and profitable trading


