Has it run out of STEEM? Or building for a STEEM breakout?Steem is in a ominous place right now. It is down 95% from its all time high and this is what I call the coin graveyard.
It has 3 possible outcomes:
1) It continues to drop and it dies here (dig a grave for it)
2) It keeps churning sideways (walking dead)
3) It builds up steem and breaks out to the upside
People go to these coin graveyards looking for a pulse from their once favorite coin. Occasionally a coin will revive and come back to life. This is the bargain basement of neglected coins. I don't expect Steem to break any new highs of course, but if it gets back to its 0.236 Fib level we're looking at $2.20 which is a 500% boost from here. I've known some 3 legged dogs that can run a quarter of the race (0.236) if its motivated enough. (All it takes is a pork chop tied to a stick).
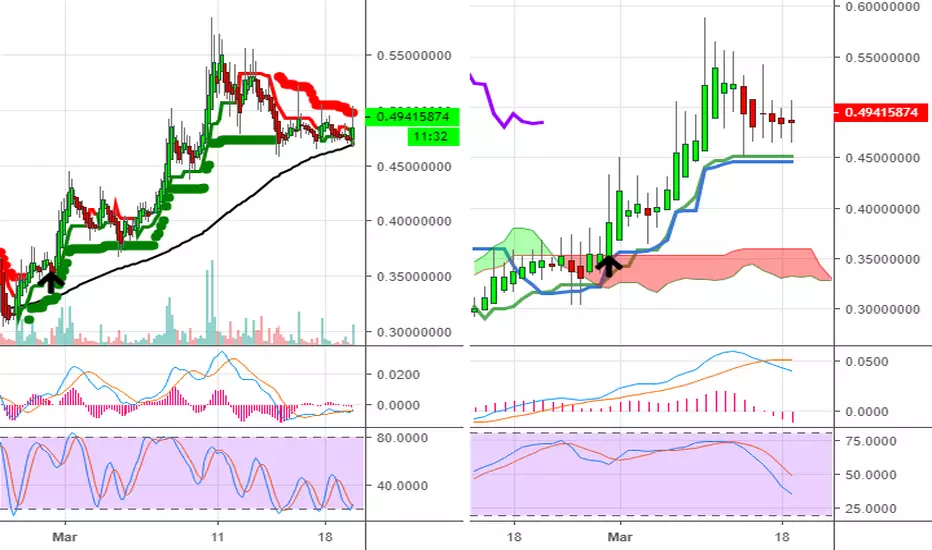
Why STEEM and why now? If you look at the moving averages you may see a glimmer of hope. The price is getting close to the daily 200 EMA and it may break out of that. Many other traders have a habit of buying when a stock or crypto breaks out of the 200 EMA/SMA so the price may get a boost. There has been a moderate amount of volume accumulating this year, so it may have some gunpowder to power the launch. A breakout of the 200 EMA will also coincide with a breakout of the wedge that had been forming for the past 6 months. You could call it a double breakout. :-)
I don't have any money in Steem, but if I were looking at it today I would wait for the actual breakout of the 200 EMA. This will cost me 20% but it also means I won't have my money tied up if it continues to move down. I don't like dead money sitting on a coin that may or may not be revived. Remember, the price hasn't poked its head above the 200 EMA since May 2018, so the price could continue to drop and I refuse to tie up money in it now without seeing a spark of life. If it costs me 20% to wait for it to break the 200 EMA, so be it. There is a little bit of support from the 150 SMA so things are looking up (a little). I wouldn't put a lot of faith in the 150 SMA because the price has fallen through it several times this year.
If the price doesn't break out of the 200 EMA and falls through the bottom of the wedge, I would put in a stink bid or an alert around 0.21 and hope it gets hit by the fall (pun intended). There has been support at this price in the past and we should get a bounce off of it in September or October.
Well, that's how I see it. This is not investment advice. This is how I would play it if it were up to me. Please do your own due diligence when buying or selling cryptos.
STEEMUSD trade ideas

Steem Price Analysis STEEM / USD: Pressured On All SidesSteem / USD Short-term price analysis
Steem has a bullish short-term trading outlook, with the cryptocurrency still holding above its 200-period moving average on the four-time frame.
The four-hour time frame is showing that an inverted head and shoulders has been triggered, with the bullish pattern twice failing to meet its overall upside objective.
Technical indicators on the four-hour time frame are bearish and show scope for further downside.
Pattern Watch
Traders should note that a bearish double-top price pattern is currently present on the four-hour time frame.
Relative Strength Index
The RSI indicator has turned bearish on the four-hour time frame, with the indicator still showing scope to trade lower.
MACD Indicator
The MACD indicator on the four-hour time frame has turned bearish and is currently generating a sell signal.
Steem / USD Medium-term price analysis
Steem has a neutral medium-term outlook, with the cryptocurrency now testing its trend defining 200-day moving average.
The daily time frame is showing that a complex head and shoulders pattern has formed, following STEEM / USD buyers inability to rally the cryptocurrency above the April trading high.
Technical indicators on the daily time frame remain bullish, although downside selling pressure is building.
STEEM / USD Daily Chart by TradingView
Pattern Watch
Traders should note that a breach of the current monthly trading low could trigger a bearish breakdown towards neckline support.
Relative Strength Index
The Relative Strength indicator on the daily time is bearish and highlights the growing medium-term weakness in the STEEM / USD pair.
MACD Indicator
The MACD indicator on the daily time frame is bullish, although downside pressures are building.
Conclusion
Steem’s current inability to make new higher price highs is starting to weigh on its overall sentiment, with the sellers now probing towards its key 200-day moving average.
Continued weakness will further strengthen the medium-term bearish case for the STEEM / USD pair, with the formation of the complex head and shoulders pattern on the daily time frame offering a warning of the potential path ahead for the cryptocurrency.


Steem .88 I marked the A and B a while ago.
We hit the A....
STORSI turn bull
66 MA is way up above a dollar so that's a target too.
BUY BULLS OBEY.
This is financial advice from a homeless person, just so now you know. Are you responsible for your own actions?

STEEM IdeaSTEEM Idea - I'm not sure if I should go long or short, but I am leaning on long. Stop loss will save my rear if I am wrong. :)
100% Opinon

STEEMBTC and STEEMUSD Pairing looks good to go!STEEMBTC and STEEMUSD Pairing looks good to go! ALL IN MY OPINION, not fact.


STEEM . The BULL within the BEARMarch 12 2019
Current Price $0.53
.60 Resistance
.33 Support
Macro Daily Bullish Descending Wedge.
Long Downtrend pressure going back to September of last year.
Recent Uptrend Recovery from Bearish Crypto WInter Lows.
However, Bulls have overperformed. Oscillators are overbought. Price extended beyond the Bullish channel.
What's next? I dunno. Maybe a range between 60 and 30 cents for a while. Or pressure builds in the descending wedge and a bullish breakout to the upside targets of $0.88.
Final thoughts. No expectations. It's just something to keep an eye on. Steem Back Dollars continue to stay close to dollar parity. Steem however doesn't appear ready to do more than range for a while. If one is thinking of cashing in to pay bills, now might not be a bad time unless one is convinced price will continue it's multi day bull run another 30%.


STEEM at 3 month high. Short term LONG favored acc. to DMIBITTREX:STEEMUSD
The +DI is above the -DI and the ADX is twice the required value to term the market as trending .
So I can say, although conservatively, that short term long positions may favor the brave. However the market has tested the support line more number of times than it has breached the resistance line - that could indicate a pullback happening pretty soon.
Play safe! Good luck

STEEMUSD Big Buy SignalPattern: Channel Up on 1D.
Signal: Bullish coming off a Higher Low.
Target: 0.56000 (estimated Higher High and Resistance).

Long Term on Steem—Weekly..HUGE MOVE INCOMING OVER THE NEXT YEARMACD, 1st Wave Percentage Gain vs. 3rd Wave Percentage Gain HUGE move coming up.


24/01/19 - $STEEM much go upSteem is pampin & I bought some with $DOGE.
Take a look on dis $STEEM because its a real thing.
Cu later frens


Steem is very, very close to bottom- look at the curves in the volume on Daily chart. Normally a bottom can be indicated by 2 consecutive curves like that. 1 for the dead cat bounce and 1 for the real bottom. I'm almost certain that Steem is gonna find its bottom this month or next.
- Rsi Almost hit the oversold on weekly, still have a bit more to go.
- Rsi is forming a bullish divergence on Daily
- It's about to hit the long-term trend line again, last time it hit the long-term trend line, it goes back to test the 200 ema (> 300% profit)
- About to hit a very strong and solid support at 0.2$ - 0.25$
How to play this:
Layer ur buys at 0.25$ and accumulate all the way down to 0.2$.
If you haven't ever experienced a 300% profit in Crypto, now this is the time. You're welcome.
**Follow me for more good signals, from a 4 years experience Stock & Crypto trader.

Good levels for long positions on steemI think Steem is an underrated coin. I'll keep buy it and this is great time to buy it )

Stee/Usd .15 centsBe carefull out there. Lots of alts look like they are about to capitulate.
------If you have any coins that you would like Me to check out just leave the a message and I would be more than happy to check them out for you------
------If My charts have helped you and you are feeling generous-tips welcomed :) thanks------
Btc- 1HrzkkMTJZHvLxgutmNT9qNAussZwSBrf8
Ltc- LNhiQ2uEjUhy8UwmXUk1sgA9ZSXqSBkKRV
Eth- 0x85a2db972B76b8d8eAB52F77aB499CD5F74eDfaF
Bch- qr44ltflnphqprc34lmg9nz5zcr6dy0wdcqvx3q9u8
Iota-XTFHKGXUVPTQXFKLWDILPIYASLUIMK9GIJOGXACLEIPIOJI9LVYPGWDYCREXZCEYZ9MZLJJXPYDMRWWTYOYRKBZCCW


steem wait to break falling wedgeNot much to say, waiting price to break falling wedge's resistance.
Once price break with high volume, I will go long for sure.

STEEMUSDOverall the market looks good. If continue the bullish trend and break through the consolidation area, would be a very good sign, and the price will more likely continue much highere.
I see this price as a really good buying opportunity. Longer term I see STEEM taking off like a rocket.
