STEEMUSD trade ideas

STEEMUSD Near Future ForecastNote: this is an abbreviated version of my analysis on Steemit: steemit.com
Observations
Waves 1 through 4 of both impulses fell below the 0.768 levels of their respective Fib retrace
Waves 5 fell in the 0.768 – 0.618 region
Waves 5 were repelled by the top of the channel
Both corrections started with the top of the triangle around wave 5 of the prior impulse and the bottom between waves 3 and 4
Waves A, B, and C all fell below the 0.768 level
Projections
The C wave of the current correction will pierce the bottom of the triangle around April 27
Price will rebound from the bottom of the channel around May 13
Price will continue to be trapped in the triangle until around May 17 – 18
Waves 3, 4, and 5 of a third impulse will respectively touch the 0.5, 0.768, and 0 levels of the second Fib retrace around June 1, June 29, and August 20 – 21
Wave 5 will touch the top of the channel again around August 20 – 21
Confirmation
The MACD is currently in good form. We could see the histogram briefly turn negative, so long as it stays in the wedge (white trendlines), which could correspond to the move below resistance at the end of wave C, but we’d like to see a bullish divergence in the form of continued upward movement from the trend lines as confirmation and a quick recovery.
The Stochastic RSI is currently heading further into overbought territory, so a downturn could be impending, confirming the the C wave down.
Please keep in mind that these are only approximate projections based on historical patterns, that what’s past is prologue, and that these forecasts will hold true until they don’t, at which point they will evolve with market conditions.
Make sure to follow me on Twitter at twitter.com/TheGaloisCxn
or StockTwits at stocktwits.com/galoisconnection .
If you found this analysis insightful, please consider helping to support my work as an independent analyst by donating to one of the addresses below, using my referral link to sign up for your own Universal Basic Income on Mannabase at mannabase.com/?ref=b4aba8dc22 , or by upvoting and sharing my work on Steemit at steemit.com/@galoisconnection .
BTC: 1FmczGKN4h3gaaGV6srqEThNQucnyD31zN
BCH: qzryuezy63ga4wc7kk0qmj7ce4cespcq2udezx52ag
ETH: 0x94C4aBD95f1e33a9e553B7EA3147257dA797bF42
LTC: MSRPU5PvY3TyDFb86CNyp8VVMsddfNTBc4
Disclaimer
The above analysis is based on reasoned conjecture and opinion, and is intended solely for educational or informational purposes. It is not intended to be, does not constitute, and should not be construed as a recommendation to buy or sell any security or instrument, or to participate in any transaction or trading activity. Seek a duly licensed professional for investment advice. The above is derived from information believed to be reliable; however, we make no representations as to the accuracy, completeness, suitability, or validity of any information provided. We accept no liability for any errors, omissions, losses, injuries, or damages arising from its display or use. All information is provided as is, with no warranties, and confers no rights.

STEEM USD moving to 3.3 USD?Steem is on the rise, and could have started it's second impulse wave set, which would confirm the reversal from the bearish period we have seen the last couple of months.
RSI (4HR): 59 and moving up with lots of room to the upside
MACD: Upwards trend
Fib price projection from the correction of last impulse wave set = 3.3 USD.
NOTE: This is not a trading advise, just for your entertainment.

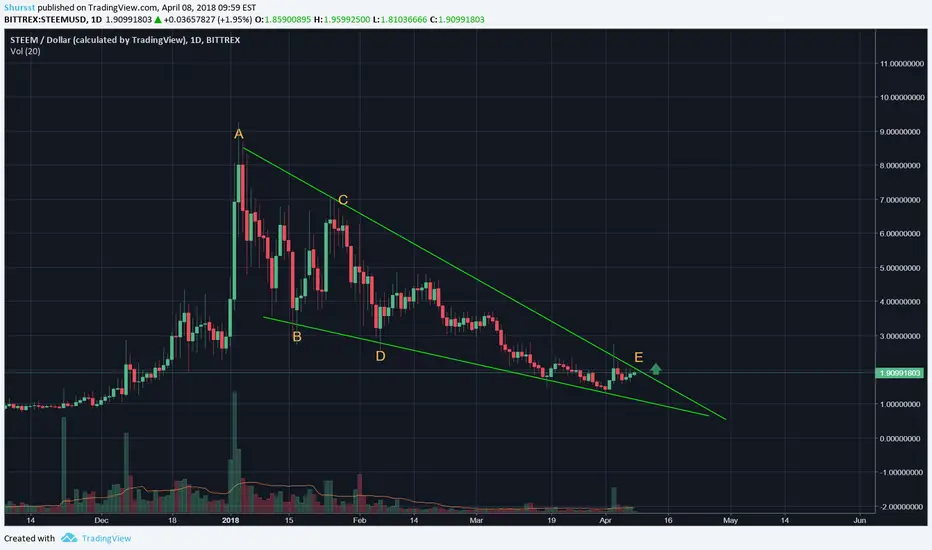
STEEM: Potential breakoutSteem almost finished the ABCDE falling wedge pattern which can be played very profitable.
Watch the green resitence line for a breakout.
STEEMUSD / Are the tides turning?This post is part of my Technical Analysis Trading Blog on Steemit. please come over to Steemit and join in!
steemit.com

STEEM, STEEM/BTC Just Broken Out! What's Next?As you can see above, STEEM (USD) has just broken out of its long consolidation period and wedge pattern. The bullish divergence in both the RSI and MACD already gave us a sign of a possible reversal coming.
The MACD was also in a long consolidation period and wedge as well, STEEM had to break out one way or the other. And since it has already retraced significantly, the breakout would more likely be up then down.
Well, we don't have to guess or wait any longer cause the awaited breakout in STEEM has just occurred! But what's next for STEEM now it has just broken out in the short term? Let's take a look.
If we take a look from the start of the breakout and the retracement that followed, STEEM bounced nicely off its 12 ema around .0002700 satoshis, which was a previous resistance level as well. So old resistance becomes new support.
Also the bounced was between the 0.500 and 0.618 fib. level. These fib. levels are usually good levels for a bounce or support after a wave 1 breakout and a correctional wave 2 if you take the Elliot Wave theory into account:
If the correction/wave 2 is done and .0002700 satoshis level is the current/new support level, then we might see STEEM make a wave 3 or another move up again soon.
So if you think STEEM is going to make another move up, then this is how you can trade it for a daytrade or a short-term swing trade.
Trade Instructions STEEM/BTC (Binance):
Buy Zone:
.0002700 - .0002850
Profit Targets:
1. .0002998
2. .0003195
3. .0003382
4. .0003552
Stop Loss:
.0002595
Leave a comment if you have any questions.
And until next time, good luck with your trading!


STEEM! GOING LONG ALL THE WAY! +1000% Gain On Investment!This has got to be one of the best investments I've seen so far.
I will definitely give updates on this crypto!

Steem forecasted to reach $12 / $14 by June. Daily MACD Crossed.Steem seems to have formed a symmetrical triangle on the daily chart similar to what is seen on LTC and OMG (please see link below). The conditions of the symmetrical triangle is very common to what was published for LTC 7 OMG. If there is an outbreak to the upside, prices can potentially reach $12 to $14. This should be achieved between June to July as long as BTC keeps moving in the upward direction.
MACD on the daily is has crossed over which is a good sign of things to come.
The following conditions have been met for the symmetrical triangle.
The general trend of Steem is to the upside. We have consolidated in the triangle after a bullish move.
The triangle has been formed with 3 points on each side.
We can see the volume reducing
The triangle has a duration of 3 months starting from January
The breakout will be occurring at least 3/4 of the way through the pattern
Still waiting for the following.
We are still waiting on the breakout direction. We need this to be to the upside for the prediction of $12 to $14 to be achieved.
We are still waiting on the breakout confirmation.
These are just my opinion. DYOR before using anyone's opinion for trading.

Steem forecasted to reach $12 / $14 by June. Daily MACD Crossed.Steem seems to have formed a symmetrical triangle on the daily chart similar to what is seen on LTC and OMG (please see link below). The conditions of the symmetrical triangle is very common to what was published for LTC 7 OMG. If there is an outbreak to the upside, prices can potentially reach $12 to $14. This should be achieved between June to July as long as BTC keeps moving in the upward direction.
MACD on the daily is has crossed over which is a good sign of things to come.
The following conditions have been met for the symmetrical triangle.
1. The general trend of Steem is to the upside. We have consolidated in the triangle after a bullish move.
2. The triangle has been formed with 3 points on each side.
3. We can see the volume reducing
4. The triangle has a duration of 3 months starting from January
5. The breakout will be occurring at least 3/4 of the way through the pattern
Still waiting for the following.
6.We are still waiting on the breakout direction. We need this to be to the upside for the prediction of $12 to $14 to be achieved.
7. We are still waiting on the breakout confirmation.
These are just my opinion. DYOR before using anyone's opinion for trading.

Something like thisThis is just what I see in the chart. STEEM has to go through long consolidation before reaching the all time high again.

Steem VS USDExpecting full retrace to .85/USD. No support is evident above this.
Very likely to drop short term below this as full capitulations begin.
Measured purchases should be considered at .85.
More significant accumulations are not recommended until after a 3 day continuous rise in the daily (closing) price.
I am very bullish on Steem long term and look for it to retest its highs before year end or shortly there after.
Crag

Steem repeating last cycle?So STEEM/BTC is currently doing its third wave from its great cycle.
In that third wave we are currently in the 4th wave.
I think it will take some time before it can lift off and start its 5th wave.
Basically the last time, we touched the 0.786 and then consolidated for 120+ days.
Think we have to consolidate again for a while, before this coin will lift off to the moon.
Watch the 0.786 and accumulate every time it touches that fib. level.
If you have any questions, please ask!
#HAPPYTRADING
#LOVE

STEEMUSDIf it breaks through the support level, it's a really bad sign. I think the price will be for some time in the consolidation area. The price has to break the key resistance before we can confirm a bullish trend.
I see this price as a really good buying opportunity. Longer term I see STEEM taking off like a rocket. I do believe that it is well within reason that STEEM reaches $10-15 or highere by year end.

STEEM BY DANIEL BRUNO, CHARTERED MARKET TECHNICIANSTEEM IS ONE OF THE MOST ROBUST ALTCOINS BUT ITS FLAILING IN THE CRYPTO ROUT
RETRACING ENTIRE UPMOVE FROM LATE DECEMBER, JUST LIKE ANY OTHER CRYPTO
SIMILAR PATTERN TO OTHER CRYPTOS, INSPIRED BY BTC DAYS LATER, THEN COLLAPSES IN HARMONY WITH IT
FAILED AT 8X1 OF THE 12-31 BREAKOUT
FAILED AT 4X1 OF 11-29-17 RISE
FORMING A COIL THAT WILL PRODUCE ANOTHER BIG MOVE UP WHEN BTC STOPS FALLING
DANIEL BRUNO, CMT


STEEM Possible ABCDE Triangle EndingI wanted to point out that there is another ABCDE Triangle formation that may still be valid for STEEM and the others i've covered such as EOS. These types are common in Crypto markets. But if BTC really falls off a cliff, then the alternate (IN YELLOW) is in play and we have a slow grind to new lows and probably a few months of sideways ups and downs until the markets begin to wake up again

Steem Triangle May Be CompleteUnless BTC decides to go sideways for a few months or weeks, to me this could go at any time


Steem sell now!!Steem broke bearish out of it's channel. It will come back to the drawn trendline you should buy here!! because steem is forming a triangle and when it breaks out of the triangle it will be a very bullish breakout.
Ride the waves to the moon with me!
Happy trading!

Steem bottomed outLooks like wave 2 of the elliot wave has been completed. I have counted the waves down and this count fits. The C sub wave has found support on subwave 1 of wave 1. Also, subwave 4 of 1 had support. I show it here with the red line. The MACD and RSI are showing bullish divergence on the daily chart. Wave 5 could bring Steem prices as high as $22. A low end wave 5 would bring in about $15 and wave 3 would then be $10. Since wave 2 retraced a lot wave 4 will not retrace much. For this count not to be correct it will need to drop lower than the C wave of $2.20. As wave 3 progresses we'll get a better idea of a wave 3 top which ultimately will help show a wave 5 top more clearly. Good luck!
Conservative wave 3 TP $10.29
Conservative wave 5 TP $15.01
Aggressive wave 3 TP $15.01
Aggressive wave 5 TP $22.64
