STMX Analysisits my personal analysis lets see when it break the resistance but soon its will break keep eye on it
STMXUSDT trade ideas

STMXUSDT WShare your opinion in the comments and support the idea with likes.
Thank you for your support!

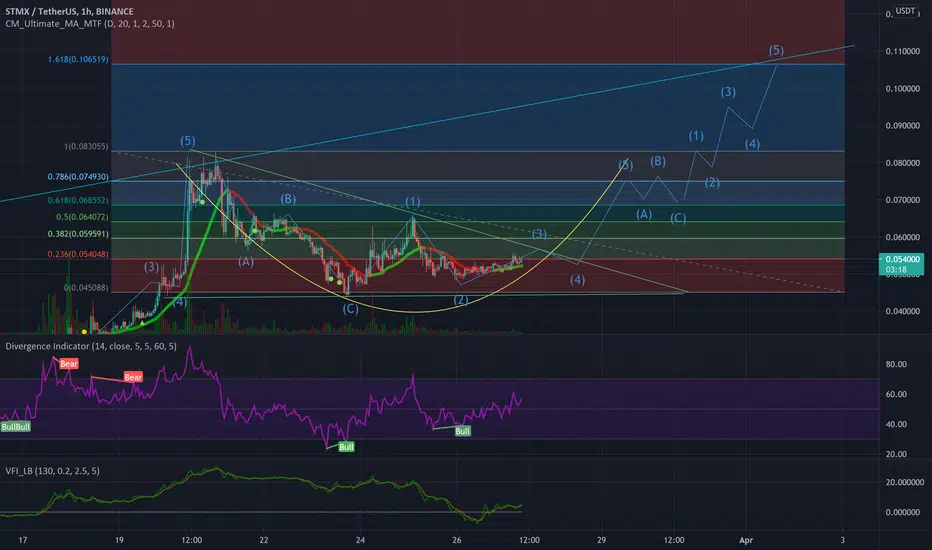
STMX UPDATEAfter the last StormX bull run chart we had up reaching 0.083, STMX has had a very healthy retracement of 47.59% to its bottom price of 0.0438,
we are currently consolidating between 0. 05 and 0.055 being the current support and resistance , with the traction stmx has been receiving and growing interest on all socials, it would be hard to ignore a nice upside here.
All technical indicators on the hourly, daily and monthly consider it as a BUY to STRONG BUY,
The chart i have posted is based on BTC not falling to low levels, if it holds this will play out to some degree short to mid term.
this is not financial advice, please do your own research before investing.
Possible STMX/USDT breakout Idea STMX has been pretty predictable lately so let's give this another shot. Looking forward to some feedback

STMXUSDT - Long - Potential 11.12%STMXUSDT - Long - Potential 11.12%
Exchanges: Binance
Signal Type: Regular (Long)
Entry Zone:
0.060085 - 0.063261
Take-Profit Targets:
1) 0.066538
2) 0.070446
Stop Targets:
1) 0.056389
Trailing Configuration:
Entry: Percentage (0.0%)


STMX: an opportunity to buySTMX is starting to recover from its first correction. It's a good opportunity to buy in case the trend keeps going up.


Healthy correction for STMX Just one idea, potential break out after the small correction. What are your thoughts ?

STMX - $0.3118STMX was in a long term consolidation zone below $0.02. As soon as it broke out of this consolidation, we started seeing a parabolic move in STMX Price. STMX is trading just above the weak support of $0.04902. It is likely to test the lower support zone of $0.04375. As long as STMX is above this support zone, we could start seeing a move towards $0.05888, $0.08304, $0.1071, $0.1462, $0.2095, $0.2727 and $0.3118. Failure to hold the support at $0.04375 could lead to a drop towards $0.02791 as there is no support between the two areas.
STMX is currently trading at $0.0.05037 with a marketcap of $416,496,846. Its 24 hour trading volume was $276,417,169.

$STMX Inverse HnSThis token’s run is far from over. It is just getting started and now could be a great time to add during a potential inverse head n shoulders patter


Healthy correction STMXHealthy correction of STMX, no worries, still good support ma. look for price targets to buy up. as shown above.


STMX (StormX) Break Out Yet Again 🤑This isn't even a moon shot at this point, this has to be Pluto by now!!!

STMX daily bullish 🚀i was hold this coin and already gain 300% from last 2week, also the application of STORMx is good and have benefit for shopping also gain storm coin sentiment of this coin good and will reach $1 easily

StormX (STMX) waiting Optimal Entry: 250%-400% Return PotentialI personally am waiting for a retracement to an entry target. I rather miss the trade than force it or buy at the peak. However, the 4H close is showing bearish sentiment and maybe we see a few weeks of retracements and consolidations (healthy by the way) before the next jump up.
Thanks again Maikel
GOOD LUCK AND BE SAFE!

STMX DUMP TO S6 or MORE PUMP?Exchange STMXUSDT 1d Binance
Price: 0.07| 0.07| 0.04
Vol: 886,723,297|4,876,213,511|3,834,250,892
ATR: 0.0076
✅OBV: 69.0 B| 68.1 B| 63.2 B
✅RSI: 96.30| 95.78| 91.14
✅MFI: 96.96| 96.79| 95.56
✅CCI: 214.24| 244.29| 179.37
⚪️WR%: -10.98| -10.76| -13.37
✅ADX: 60.29| 57.53| 54.59
⚪️MOM: No Momentum
✅SMA: Price is Above SMA Bullish
✅ADI: +DI >DI BULLISH
✅MACD: Bullish
✅PSAR: Bullish
Support And Resistance
S: $0.010
S: $0.013
S: $0.018
S: $0.021
S: $0.026
S: $0.038
S: $0.067
R: $0.074
Volatility is very high
EXPERIMENTAL 🧪
⚪️RSI:No divergences
⚪️MFI:No divergence
⚪️FVE: No divergence
⚪️Volume: No Trend or volume confirms trendt
STMX is a good project, I still expect a good pullback after a good rise.

MACD the Champ?On the 15 min chart the MACD is 6/8 calling price action buy/sell.
%%Trade at your own risk. I am not a financial advisor. I am not giving you financial advice.%%

STMX following technical signals?Although the timing has not been perfect, STMX seems to be following technical signals. Specifically, RSI and MACD, when the candles are consolidating and RSI/MACD are overbought, a breakout to the upside seems to follow. Definitely something to pay attention to.
Trade at your own risk. I am not a financial advisor, I am not giving you financial advice.

$stmx easy money with a little dash of riskheres a RISKY but PROFITABLE buy signal for you guys. If STMX stays about 0.0465 by 8 PM, buy it! It shold guarantee insta gains in the short term. Target will be 0.058 - 0.059
Bought it while watching the hourly and its been bullish on the 1h, 4h, 1d, 1w
