Storj Sweeping Sell Side Liquidity🌐 In the ever-shifting landscape of the cryptocurrency market, Storj (STORJ) has taken center stage with a compelling narrative. It's been on a mission to clear global sell side liquidity and seems poised for an upward trajectory. STORJ's strategy has often involved liquidity sweeps, signaling a shift in direction, and it may be gearing up for another significant move. Let's explore this intriguing development. 📈🌐
Sweeping Global Sell Side Liquidity:
Storj's recent actions are akin to a skilled chess player making strategic moves on the board. The project has been actively sweeping global sell side liquidity, effectively clearing out sell orders clustered around specific price levels. This maneuver can set the stage for a substantial upward movement.
A History of Shifting Paths:
Storj's track record shows that each time it engages in liquidity sweeps, it subsequently embarks on a new price direction. This ability to adapt and switch paths is a hallmark of its dynamic nature.
The Path Upward:
As Storj continues to clear out global sell side liquidity, the path upward seems to be on the horizon. It's as though the project is gearing up for its next significant move in the crypto chess game.
Trading Strategy:
Observation: Keep a keen eye on Storj's price action and how it interacts with liquidity sweeps.
Risk Management: As always, implement prudent risk management practices to safeguard your investments in the crypto market.
Stay Informed: Stay up-to-date with Storj's fundamentals and any news that could impact its price movement.
Conclusion:
The cryptocurrency market is full of intricate strategies and maneuvers, and Storj's actions are a testament to its adaptability and dynamic nature. While liquidity sweeps can provide insights into potential market movements, they are not infallible.
As you follow Storj's journey, be vigilant, stay informed, and be prepared for the twists and turns that this captivating project might offer.
❗️Get my 3 crypto trading indicators for FREE! Link below🔑
STORJUSDT.P trade ideas


StorjA rather short picture emerges in this asset, let’s look at it. First, let's look at the local downward trend (it also acts as resistance), which formed after the upward trend was broken down. We tested it a couple of times, but we never saw any penetration.

STORJUSDT.P - IS THAT GAME OVER ? #STORJUSDT.P is over ! I Think Storj is over. It's very good point for make a short. small SL , Biggg Target ! Enjoy it.
It's not an investment advice !!

STORJ sell setupyou can setup short position on STORJ/USDT
OPEN: 0.375
Target: 0.36
LEV: 10X to 25X
Capital: 25% off all capital
OK?

Long storj! Storj seems to be accumulating momentum since falling from resistance.
Some how a golden breakout have gain my attention⚠️
Let's see what happens

STORJUSDTBINANCE:STORJUSDT Long idea
⛔"Daily crypto market analyses I provide are personal opinions & not financial advice. Trading carries risks, so do your own research & seek advisor's help.#DYOR"
Don't forget to like and comment

STORJ long setupHi, dear traders. how are you ? Today we have a viewpoint to BUY/LONG the STORJ symbol.
For risk management, please don't forget stop loss and capital management
When we reach the first target, save some profit and then change the stop to entry
Comment if you have any questions
Thank You
STORJ 1H Analysis with Influences from 1D Fibonacci LevelsIn the STORJ 1-hour chart, a clear bearish trend is evident. While the provided technical indicators from the 1H chart mainly signal bearish momentum, the 1D Fibonacci levels could play a pivotal role in potential bounce-backs or resistance areas.
Analysis:
Fibonacci Levels (from 1D):
The current price of STORJ in the 1H chart is approaching the 0.5 level at 0.3669. This could act as a significant support, and if the price respects this level, we could expect some buying pressure here.
Should the price continue its downward momentum, the next major support would be at the 0.618 level (0.3253).
On the upside, the 0.382 level at 0.4084 might act as resistance if the price were to rebound.
Stochastic Oscillator: Given its oversold position, this suggests a potential pullback or temporary reversal might be imminent, which aligns well with the approaching Fibonacci support at 0.3669.
Bollinger Bands and MACD: Both indicators continue to indicate bearishness in the short term.
Most Probable Scenario:
The STORJ price is likely to continue its bearish trend in the short term. However, the 1D Fibonacci level at 0.3669 could act as a strong support. If the price respects this level, we might see a bounce-back or consolidation around it. If it breaks through, the next target would be the 0.618 level at 0.3253. Conversely, if a rebound happens, the 0.382 level at 0.4084 will act as a key resistance.
Conclusion:
While the STORJ 1H chart indicates a bearish momentum, the 1D Fibonacci levels can provide key areas of interest for potential reversals or consolidation. It's essential for traders to monitor these levels closely for any signs of price reversal or continued momentum.

STORJ Double top neckline broken STORJ UPDATE: In my last update about STORJ rising wedge…. STORJ broke it down and headed for the support… As we can see that STORJ broke the 4hrs TF neckline support of the double top that was created and consolidating below it which is preparing for now downside movement to mitigate the strong support at 0.344
Good to take a short entry at CMP tor the follow Targets below 👇
0.3886
0.3689
0.3440
Manage your risk and don’t be greedy
Follow for more market update or chat me up

#STORJUSDT #LQR #TOBTC #LaqiraProtocolThe price is in a weekly trading range at the highest Level of the seller and at the lowest point of our buying Level in the lower time are the important areas on the chart are specified. After confirming and adapting to Bitcoin levels, you can open a trade. This analysis is not an offer to buy or sell.

STORJ mirror candle shortWe can see the mirror structure of candles, this is confirmed by the volume holding the price, which indicates an increase to the previous high and a local rollback down, so we can open a short position at the top. The intersection of the MA 200 and MA 50 lines on the 4H timeframe and 2 touches of the bottom with candles, which hints at further growth ☝️

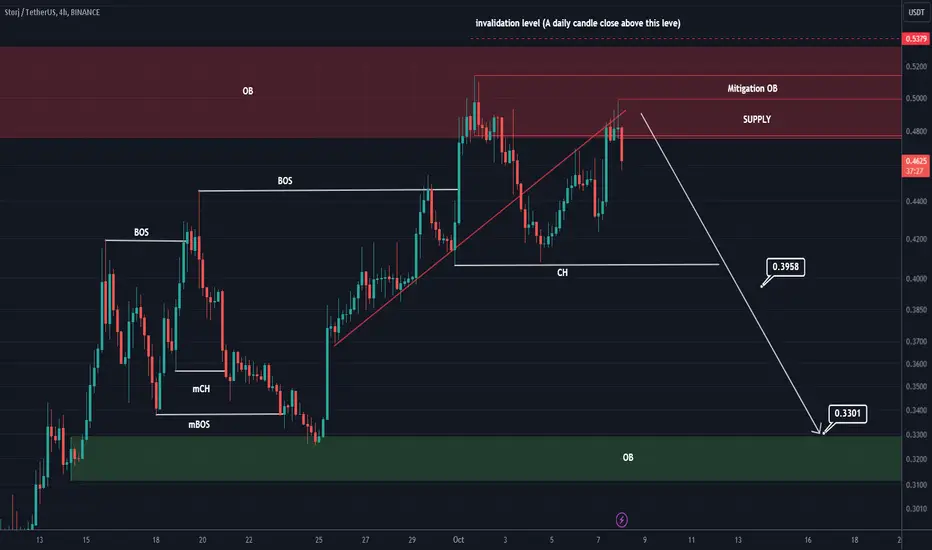
STORJ is close to dropStorj has been stuck in a resistance zone for a long time.
Now a trend line has been broken and the price hit it in the resistance zone and some new resistance zones that you can see on the chart with the names of mitigation OB and supply.
In my opinion, storj can move towards two announced targets from here.
I specified the invalidation level, closing 1 Daily candles above this level will violate the analysis
For risk management, please don't forget stop loss and capital management
When we reach the first target, save some profit and then change the stop to entry
Comment if you have any questions
Thank You
#TRB/USDT is trying to hold PDL as a support in 4-Hour TF!#TRB/USDT is trying to hold PDL as a support in 4-Hour TF!
LSE:TRB needs to hold this zone to gain bullish momentum. Breakdown and retest below the zone is bearish, and we can short it.

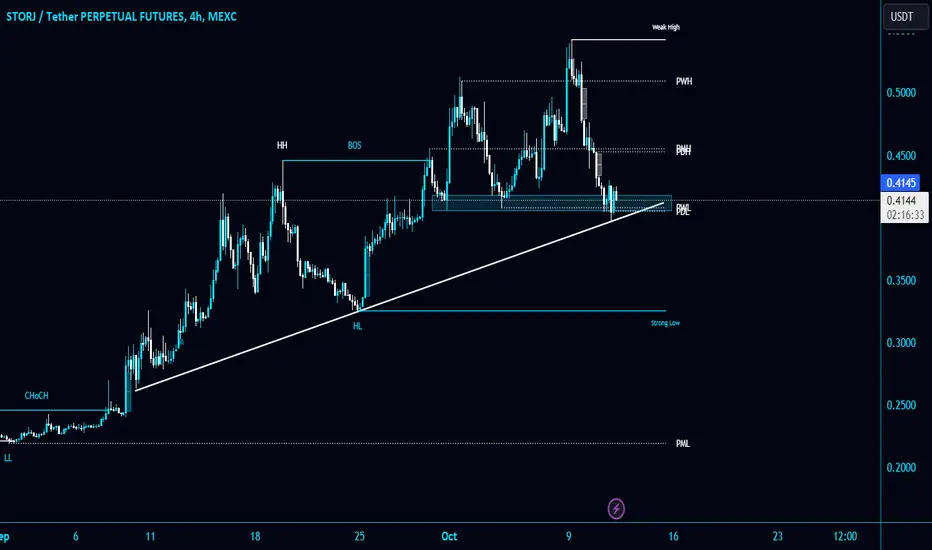
#STORJ/USDT is testing the major trendline and PWL support in 4-#STORJ/USDT is testing the major trendline and PWL support in 4-Hour TF!
$STORJ needs to hold the trendline to gain bullish momentum. If #STORJUSDT breakdown/retest the trendline we can short it.
Analyzing STORJ: Spotting Prominent Levels and Planning BreakoutIn this analysis, we will delve into the price action of the cryptocurrency Storj (STORJ) utilizing 1-hour and 5-minute time frame charts.
On the 1-hour chart, we've identified several notable levels, with a specific focus on the level 0.4077. This level was chosen due to its significance, having been tested twice, making it a key point for analysis. We plan to enter a position upon a downside breakout of the 0.4070 level as it approaches. It's essential to note that the approach to this level should be gradual, and it's preferable to observe trading activity in this area before making a trading decision.
A similar approach is applied on the 5-minute chart, where the mentioned levels are also visible. Analyzing on a shorter time frame provides additional clarity for more precise trade planning.

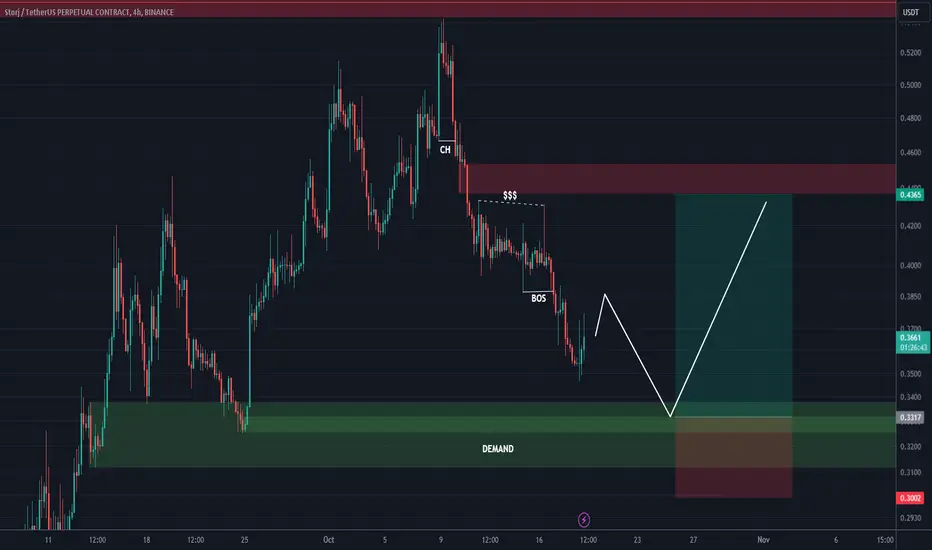
STORJ/USDT Ready for Potential Correction? STORJ Analysis Today💎Paradisers, focus on STORJUSDT! It's currently moving within an ascending channel, hinting at a possible correction due to the overhead supply zone.
💎In recent times, Storj has been consistently following this ascending trajectory. However, a correction seems imminent. It's worth noting that STORJ will firmly anchor to a significant support level at 0.4282.
💎Below this, there's a clear demand zone accompanied by a Bullish OB. If STORJ dips below the support, it's likely to approach the demand zone highlighted on the chart.
💎Sharpen your trading strategies for STORJ with ParadiseFamilyVIP. Delve into our expert analyses on Storj and other potential tokens, streamlining your crypto journey.

StorjusdtIn this idea as usual I used Fibo+Sup/Res
Here I'm looking for long position with RRR 1.8
We have in the Fibo red line Re-test So I will open my position from there.
I don't use any price action candles. I entre with TP and SL as u see in the screen
This is not financial advice.. If u like my ideas don't forget to follow me


STORUSDT Short from resistance. Possible H AND S Pattern?As we can see from the chart STORUSDT has reached the daily resistance level (Purple line). Looking at the price action we have a nice pin bar which closed below the daily resistance. These candles are a strong indication of a possible reversal. More conformation is a rising wedge pattern. This is a reversal pattern also, and the top trend line also corresponds with the daily resistance.
My bias is still on the short side after getting stopped out for a small loss previously. I will take a short trade on the close of the pin bar and my stop loss will be above the top of this candle. Entering on this candle is an aggressive move. So the safer option would be to wait for the breakout or for price to retrace. This would add more confluence to you trade by doing this.
There also could be a possible head and shoulder pattern developing, which could give some traders a good opportunity to trade if this does actually happen.
Just something to keep in mind.
Also keep in mind the swing fib levels and watch price action at these key levels. They can be used to take part profits along the way, or add into your trade.
Good luck!

✴️ Storj Goes Bullish Today (1-3X Growth Now Possible!)Yesterday Storj challenged EMA50 as resistance but ended up closing the day below this level.
Today, STORJUSDT manages to move past EMA50 (0.2602) on rising volume. As soon as the day closes above this level the mid-term bullish potential/bias is confirmed.
EMA50 is marked here with a magenta line on the chart.
This is a major development. Mid-term bullish potential can translate into 1-3X of growth, which means between 200%-400% profits potential.
This Altcoin is bullish also on its Bitcoin pair, STORJBTC.
You can check the related ideas for more.
Namaste.

STORJ has strong bullrunThe coin is in the top in terms of trading volumes, the tape in the glass is active. A local uptrend has formed with rising lows along the support line and a resistance level of $0.539 to which the price is currently being squeezed.

STORJUSDT(UPDATED) ... JUST AN IDEA !!!STORJ currently testing a crucial resistance.38 , above .38 area can give further push up to test the final strong resistance .42 area ... after confirmation the TP will be .57...
if the current resistance fails then a downward move to .34 is also in the list ...
.32 is the current strong support for STORJ's bull run, if broken then it will be cause BTC would be bleeding....
SL : .325 area...
NAFA n plz DYOR ....
