storjusdt buy opportunitySTORJUSDT is forming a classic double bottom within a symmetrical triangle structure. Price is currently reacting from the highlighted accumulation zone, which aligns with a strong demand area. The immediate objective is a move toward $0.525, the triangle’s upper boundary, where minor rejection is anticipated. A successful breakout above this level will shift focus to the double bottom neckline, with the final target aligning with the full measured move as illustrated on the chart.
STORJUSDT trade ideas

STORJ/ USDT - SHORT SET-UP 📊 Key Technical Insights
1. Price Structure
Price recently rejected near 0.2550–0.2575 zone (supply/resistance).
Lower highs forming, indicating bearish market structure.
Current price (~0.2444) is just under minor resistance, which may confirm the start of a new leg down.
2. Risk-Reward Ratio
Risk: ~0.0131 (from 0.2444 to 0.2575)
Reward: ~0.0258 (from 0.2444 to 0.2186)
RRR: ~1:2 — Good risk-to-reward ratio.
3. Support Zones
Minor support: 0.2330–0.2300 area — could act as TP1.
Major support (TP2): 0.2186 — aligns with historical price reaction.
4. Candlestick Behavior
Rejection wicks seen near the 0.2550 zone, confirming supply presence.
Recent candles show selling pressure dominating.
---
📉 Trade Plan Summary
Component Level
Sell Entry ~0.2444
Stop Loss 0.2575
TP1 ~0.2300
TP2 (Main) 0.2186
Trend Bearish
---
✅ Confluences Supporting the Short Setup
Double/triple top formation around 0.2570.
Lower highs and bearish market structure.
Price rejected strongly from resistance zone.
Clean support zones below offer logical targets.
---
🚨 Caution
If price breaks and closes above 0.2575 with strength, the bearish setup becomes invalid.
Watch for fakeouts or consolidation between 0.2400–0.2500.

STORJUSDT 1W Analysis STORJ ~ 1W Analysis
#STORJ This is the closest support for now. Buy if you still have confidence in this coin with a short term target of at least 20%+ from this support.

$STORJ – Testing Descending Trendline Support📊 GATEIO:STORJUSDT.P STORJ is testing the descending trendline support on the daily timeframe, and it’s holding firm for now.
⚠️ This level is crucial — will it act as a springboard for a bullish reversal or let the bears take over?
👀 Watch price action closely for clues!

STORJUSDT 1D AnalysisSTORJ ~ 1D Analysis
#STORJ Buy gradually from here if you still have confidence in this coin with a short term target of at least 10%++
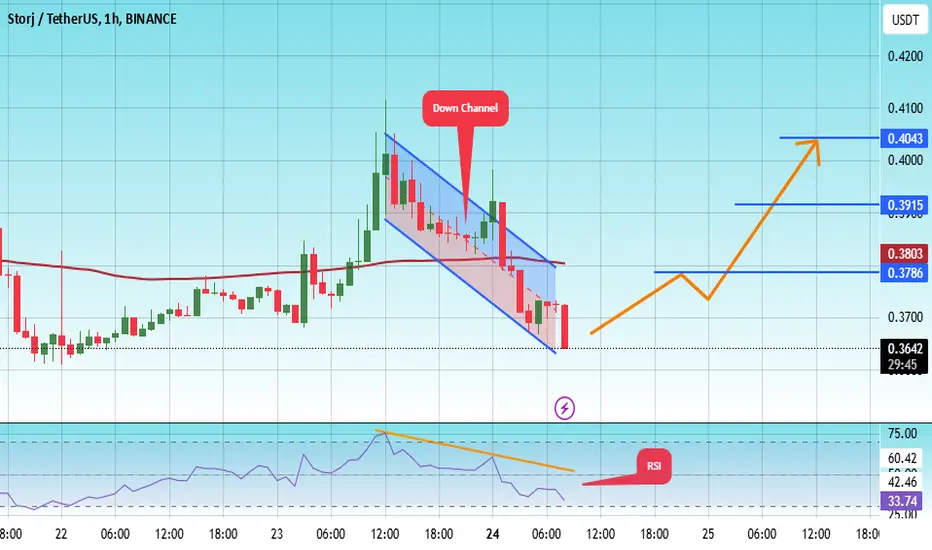
#STORJ/USDT#STORJ
The price is moving within a descending channel on the 1-hour frame, adhering well to it, and is on its way to breaking it strongly upwards and retesting it.
We are seeing a bounce from the lower boundary of the descending channel, which is support at 0.3060.
We have a downtrend on the RSI indicator that is about to break and retest, supporting the upward trend.
We are looking for stability above the 100 moving average.
Entry price: 0.3090
First target: 0.3125
Second target: 0.3170
Third target: 0.3231

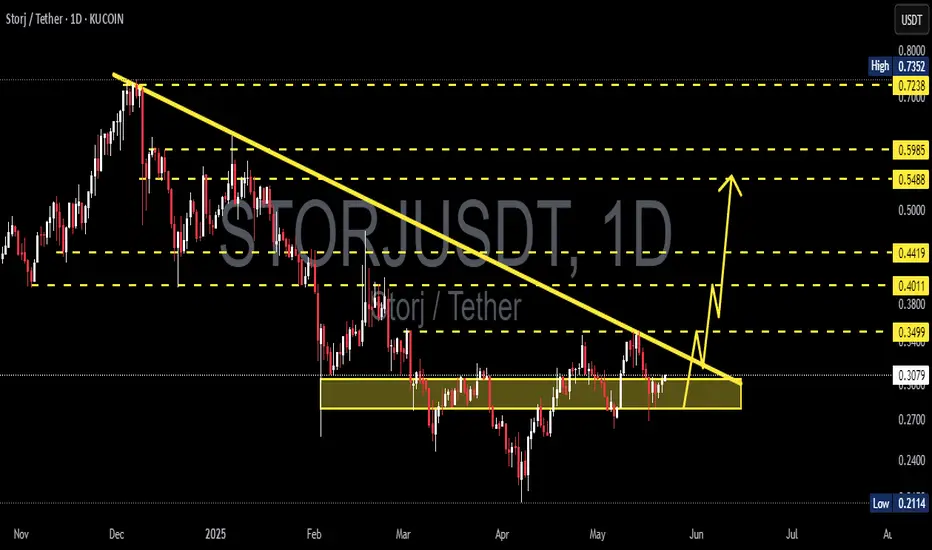
Storj —Strong Move Ahead (Easy 100-200% Profits Potential)The inverted triangles depict the bottom. After Storj moved above the 3-Feb low and broke the downtrend we entered bullish territory.
The chart was bullish when the bottom hit 7-April and we can predict a recovery, but this is only a prediction. When the action moves decisively above support, and growth starts to happen above support, then the bullish bias is fully confirmed. This is exactly what is happening here.
» STORJUSDT is trading above support and is ready to grow. This chart shows the potential for a 100-200% move to develop in the coming days. It can start within days and take only a few weeks to fully develop. This will only be the start.
After this initial strong bullish breakout, we will see growth long-term. Higher highs and higher lows. The 2025 Cryptocurrency—Altcoins bull market.
Thank you for reading.
Namaste.

STORJUSDT UPDATESTORJ/USDT Technical Setup
Pattern: Falling Wedge Breakout
Current Price: $0.2831
Target Price: $0.35, $0.45
Target % Gain: ~24% to ~59%
Technical Analysis: STORJ has broken out of a falling wedge on the daily chart, signaling a potential trend reversal. Price is retesting the breakout with bullish momentum building, confirming possible continuation.
Time Frame: 1D
Risk Management Tip: Always use proper risk management.

STORJUSDT.P Ready To Long Position with Our CGI IndicatorSTORJUSDT.P Ready To Long Position with Our CGI Indicator

STORJUSDT 1D AnalysisSTORJ ~ 1D Analysis
#STORJ Looks very bullish after successfully penetrating this resistant line.

Storj Breaking out Expecting Solid Bullish Rally Storj Chart Looking Very Good For Midterm, Testing Falling Wedge (Trendline Resistance) Successful Breakout Can Lead Solid Bullish Rally Towards 0.50$ In Coming Days.

STORJ/USDTKey Level Zone: 0.2720 - 0.2740
HMT v8 detected. The setup looks promising, supported by a previous upward/downward trend with increasing volume and momentum, presenting an excellent reward-to-risk opportunity.
HMT (High Momentum Trending):
HMT is based on trend, momentum, volume, and market structure across multiple timeframes. It highlights setups with strong potential for upward movement and higher rewards.
Whenever I spot a signal for my own trading, I’ll share it. Please note that conducting a comprehensive analysis on a single timeframe chart can be quite challenging and sometimes confusing. I appreciate your understanding of the effort involved.
Important Note :
Role of Key Levels:
- These zones are critical for analyzing price trends. If the key level zone holds, the price may continue trending in the expected direction. However, momentum may increase or decrease based on subsequent patterns.
- Breakouts: If the key level zone breaks, it signals a stop-out. For reversal traders, this presents an opportunity to consider switching direction, as the price often retests these zones, which may act as strong support-turned-resistance (or vice versa).
My Trading Rules
Risk Management
- Maximum risk per trade: 2.5%.
- Leverage: 5x.
Exit Strategy
Profit-Taking:
- Sell at least 70% on the 3rd wave up (LTF Wave 5).
- Typically, sell 50% during a high-volume spike.
- Adjust stop-loss to breakeven once the trade achieves a 1.5:1 reward-to-risk ratio.
- If the market shows signs of losing momentum or divergence, ill will exit at breakeven.
The market is highly dynamic and constantly changing. HMT signals and target profit (TP) levels are based on the current price and movement, but market conditions can shift instantly, so it is crucial to remain adaptable and follow the market's movement.
If you find this signal/analysis meaningful, kindly like and share it.
Thank you for your support~
Sharing this with love!
HMT v2.0:
- Major update to the Momentum indicator
- Reduced false signals from inaccurate momentum detection
- New screener with improved accuracy and fewer signals
HMT v3.0:
- Added liquidity factor to enhance trend continuation
- Improved potential for momentum-based plays
- Increased winning probability by reducing entries during peaks
HMT v3.1:
- Enhanced entry confirmation for improved reward-to-risk ratios
HMT v4.0:
- Incorporated buying and selling pressure in lower timeframes to enhance the probability of trending moves while optimizing entry timing and scaling
HMT v4.1:
- Enhanced take-profit (TP) target by incorporating market structure analysis
HMT v5 :
Date: 23/01/2025
- Refined wave analysis for trending conditions
- Incorporated lower timeframe (LTF) momentum to strengthen trend reliability
- Re-aligned and re-balanced entry conditions for improved accuracy
HMT v6 :
Date : 15/02/2025
- Integrated strong accumulation activity into in-depth wave analysis
HMT v7 :
Date : 20/03/2025
- Refined wave analysis along with accumulation and market sentiment
HMT v8 :
Date : 16/04/2025
- Fully restructured strategy logic

STORJUSDT buy/long (1W)STORJ is approaching a strong origin level on the weekly timeframe.
This origin has already been tapped once, but there should still be significant BUY orders remaining in this zone.
A liquidity pool has also been built up. We expect a strong reaction from this area.
We are looking for BUY/LONG positions around the demand zone, especially near the optimized entry.
A weekly candle close below the invalidation level would invalidate this setup.
Do not enter the position without capital management and stop setting
Comment if you have any questions
thank you

STORJUSDBased on on-chain data indicating excessive losses and technical data, our team believes there could be strong demand in the specified areas.

STORJUSDT 1WSTORJ ~ 1W Analysis
#STORJ Buy gradually from here with a short -term target of at least 20%+.
reason, this support continues to be maintained so far.

#STORJ/USDT#STORJ
The price is moving in a descending channel on the 1-hour frame and is adhering to it well and is heading to break it strongly upwards and retest it
We have a bounce from the lower limit of the descending channel, this support is at a price of 0.3630
We have a downtrend on the RSI indicator that is about to break and retest, which supports the rise
We have a trend to stabilize above the moving average 100
Entry price 0.3653
First target 0.3786
Second target 0.3915
Third target 0.14043
STORJUSDT 1D#STORJ is moving inside a falling wedge on the daily chart. Volume has increased recently. A clean breakout above the pattern resistance and the daily MA50 could send it to the moon. Targets are:
🎯 $0.4689
🎯 $0.5176
🎯 $0.5662
🎯 $0.6355
🎯 $0.7237

Storj Past Action & 2025 New All-Time HighStorj peaked late March 2021. In just one month it will be four years ago. The peak in November 2021, exactly eight months later, resulted in a lower high.
The previous bull-market cycle lasted one year between March 2020 and March 2021. Total growth for STORJUSDT amounted to 8386%.
The orthodox end of the bear-market happened in June 2022. We can say that the consolidation phase started after this date.
From June 2022 until present day, February 2025, STORJUSDT has been sideways.
The low in 2022 and 2023 is a higher low compared to 2020.
The low in 2024 and 2025 is a higher low compared to 2023.
We have long-term higher lows.
A new All-Time High is possible in 2025.
The story ends like this: There can be a new All-Time High in late 2025.
Thank you for reading.
Namaste.

STORJUSDT: CORRECTION OVER, ABOUT TO EXPLODEElliott Waves
-Completion of wave II of (III).
WTF
-OBV is showing accumulative correction
-Stochastic RSI is oversold and has made a bullish cross in the oversold region.
-RSI and MFI are showing bullish divergence.
-Price is testing monthly horizontal and support.
-Price is testing 5 years diagonal support.
WTF
-ADI and OBV showing accumulative correction and regular bullish divergence.
-RSI and MFI bullish divergence.
-Diagonal resistance breakout.

STORJ ANALYSIS📊 #STORJ Analysis : Update
✅There was a formation of Falling Wedge Pattern on daily chart🧐
#STORJ tried to breakout the pattern but failed to sustain. Also there is an instant resistance zone and if #STORJ breaks the pattern then we could expect around $0.5300 level
👀Current Price: $0.3967
🚀 Target Price: $0.5300
⚡️What to do ?
👀Keep an eye on #STORJ price action and volume. We can trade according to the chart and make some profits⚡️⚡️
#STORJ #Cryptocurrency #TechnicalAnalysis #DYOR

STORJUSDT 1WSTORJ ~ 1W Analysis
#STORJ Buy gradually from here if you still have a Conviction on this Coin with a minimum target of 20%+

Storj is on its way for big move!Now it's on fvg, it might go bull so big like previous highs, or to a new downtrend, so let's wait for now

STORJUSDT 4H TF - BullishKey Observations:
1. Downtrend Breakout:
The price broke out of the descending trendline, signaling potential bullish momentum.
Post-breakout, the price is consolidating above the previous resistance (now support) near $0.4482.
2. Support Levels:
$0.4482: Immediate support zone where the breakout occurred.
$0.4300–$0.4400: Strong demand zone (highlighted in blue) that previously held the price.
3. Resistance Levels:
$0.5013: Significant resistance; if breached, the price may test $0.5539.
$0.5539: A major resistance zone from previous highs.
4. Current Price Action:
The price is testing $0.4583, trying to establish a higher low.
Bulls need to defend $0.4482 to maintain momentum.
Potential Scenarios:
Bullish Case:
If the price holds above $0.4482, it may retest $0.5013.
A breakout above $0.5013 could lead to a move toward $0.5539.
Bearish Case:
A rejection near current levels and a drop below $0.4482 could lead to a retest of the blue demand zone.
Losing the $0.4300 zone would invalidate the bullish breakout.
Trading Plan:
Entry:
Look for long positions near $0.4482, with tight stop-losses below $0.4400.
Targets:
$0.5013
$0.5539
Stop-Loss:
Below the blue zone at $0.4300 to manage risk.
