STORJUSDT Long/ Short.... Just an IDEADThe Chart itself did the words required on STORJ
Do ur own research n its NAFA
ThankYou...
STORJUSDT trade ideas

$STORJ Wave 5 pendingAs indicated by the STIC indicator, we catch the breakout early, and the corrective wave last week, i wil eb expecting a wave 5 to take the price to a a near double top scenario.
As long as price holds able the yellow line, the sentiment is stil bullish.
#Trade smartly

Long and short what to do?Trend is still up but is getting critical ! We are allmost in the lower low range, when this happens we start looking for a short postiion

STORJ possible ascending channel planWatching Storj to see if price will come back to the bottom of the channel (near 0.5 fib level).
If it shows a reaction, we could be in for a 3rd wave.

STORJ/USDT 4hSTORJUSDT technical analysis based on Elliot waves.
As you can see, this currency has completed all five waves in 4 hours and will probably enter the next three corrective waves soon.

Will STORJ remain bullish?STORJ has been bullish for several days.
It has hit an important node, which is the origin of the downward movement.
It has a high chance of downward rejection.
I am looking for SELL/SHORT positions in the lower red box.
A daily candle close above 0.4444 will violate this analysis
For risk management, please don't forget stop loss and capital management
When we reach the first target, save some profit and then change the stop to entry
Comment if you have any questions
Thank You

The key is whether it can be supported above 0.3799Hello?
Hello traders!
If you "Follow" us, you can always get new information quickly.
Please also click “Boost”.
Have a good day.
-------------------------------------
(STORJUSDT chart)
(1M charts)
The key is whether the price can be maintained by rising above 0.4292.
(1W chart)
The key is whether it can receive support around 0.3457 and rise.
When rising
1st: 0.4420
2nd: 0.8409
We need to check whether we can receive support around the first and second rounds above and continue the upward trend.
(1D chart)
The 0.3799 point is an important volume profile section.
Therefore, the key is whether the price can be maintained by rising above 0.3799.
To do this, we need to make sure that the price can be maintained above the HA-High indicator.
Currently, the HA-High indicator is formed at 0.3301 and is showing signs of forming at 0.3382.
Accordingly, it is necessary to maintain the price around 0.3301-0.3382 or higher and then check if it rises above 0.3799.
Since there are no strong support or resistance points above 0.3799, caution is required as rapid movements can occur in an instant.
If you respond by selling in short installments, you are expected to get good results.
-------------------------------------------------- -------------------------------------------
** All explanations are for reference only and do not guarantee profit or loss in investment.
** Trading volume is displayed as a candle body based on 10EMA.
How to display (in order from darkest to darkest)
More than 3 times the trading volume of 10EMA > 2.5 times > 2.0 times > 1.25 times > Trading volume below 10EMA
** Even if you know other people’s know-how, it takes a considerable amount of time to make it your own.
** This chart was created using my know-how.
---------------------------------

Long only my ideaEvery trader man want to know where whale smart money stay if u swing trader flow this idea if hit stop loss must be entry martingale Insha'Allah wait & see i no need like comment o o o my 1st 2nd 3rd entry *5

STORJUSDTThis is a 1D frame analysis for STORJUSDT After bouncing off the long-term support zone, the price is currently being supported and is moving towards the first resistance line. We can see from the weekly timeframe that a strong Marabuzo candle was formed last week, which we can take into consideration that the next candles could be an upward price move to the first resistance zone with potential for growth.

STORJusdtSTORJ short set up.
Disclaimer: The trading signals provided are for informational purposes only and should not be considered as financial advice. Trading in financial markets involves substantial risk and is not suitable for all investors. Past performance is not indicative of future results. The sender of these signals is not responsible for any losses incurred due to trading decisions based on the provided signals. Traders are advised to conduct their own research and seek advice from qualified financial professionals before making any trading decisions.

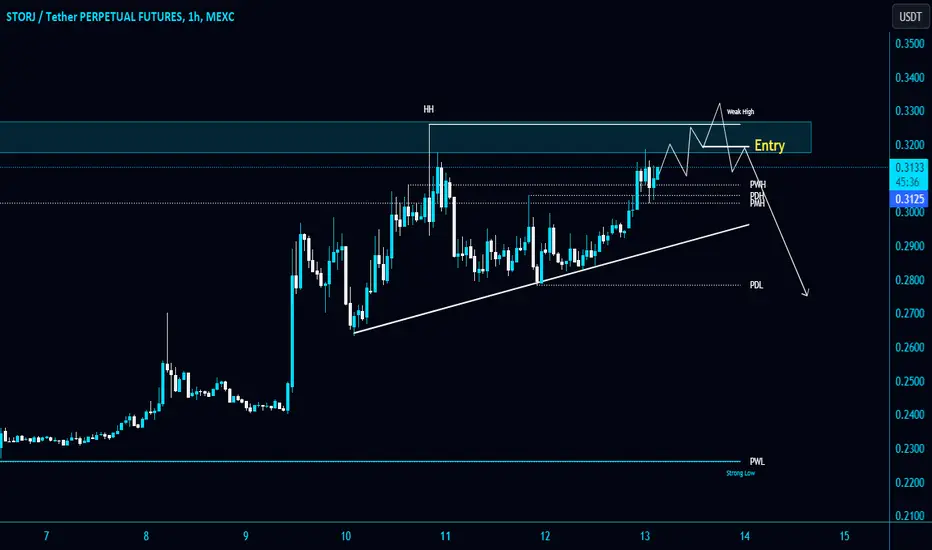
#STORJ/USDT is testing the Major resistance zone in 1-Hour TF!#STORJ/USDT is testing the Major resistance zone in 1-Hour TF!
I am expecting a scenario like this. I will wait for confirmation to Short it. $STORJ is holding PWH and PMH as a strong support.
STORJUSDTI consider this to be a good coin for scalping this week. Please wait for a new high above the previous peak before entering!
Entry: 0.27$ - 0.288$
Stoploss: 0.256$

Storj at resistancePrice has jumped 18% after correcting yesterday.
Assuming many traders panic shorted after solana crash.
Shorts are being aggressively liquidated.
Volume is flowing in, but failing to break resistance.

STORJShorting Storj at cmp perfectly back to Order back ,invalidation above at 0.30, tp would be around 0.256, 0.25 , 0.246

Storj Getting Ready for Move Towards 1.50$Seems Like Getting Ready For Massive Recovery
Formed Falling Wedge In 3 Days And Testing Trend line Incase Of breakout Expecting Massive Recovery In Coming Weeks Incase Of Successful Breakout Expecting Move Towards 12.50$ In Midterm KEEP eyes on For Breakout

STORJ Buy trade. Here is My Study On Storj
Welcome to my channel! Here you'll find daily technical analysis ofthe latest trends in the crypto market. From Bitcoin to altcoins, I'lIl be sharing my insights and predictions to help you make informed decisions
about your investments. Follow me for the latest updates and join the conversation in the comments!
Crypto technical analysis uses past price history to predict future price. It's not a guarantee and shouldn't be relied on solely for investment decisions. Consider other factors such as market trends, economic strength and
information dissemination. Use with caution.
This Is Not A Finacial Advise

Storj Analysis (4H TF)After where I inserted the G, an up move has started which could be an ABC or WXY combination.
I specified two TP. I also specified the invalidation level that closing 1 4-hour candle above this level will violate the analysis.
For risk management, please don't forget stop loss and capital management
When we reach the first target, save some profit and then change the stop to entry

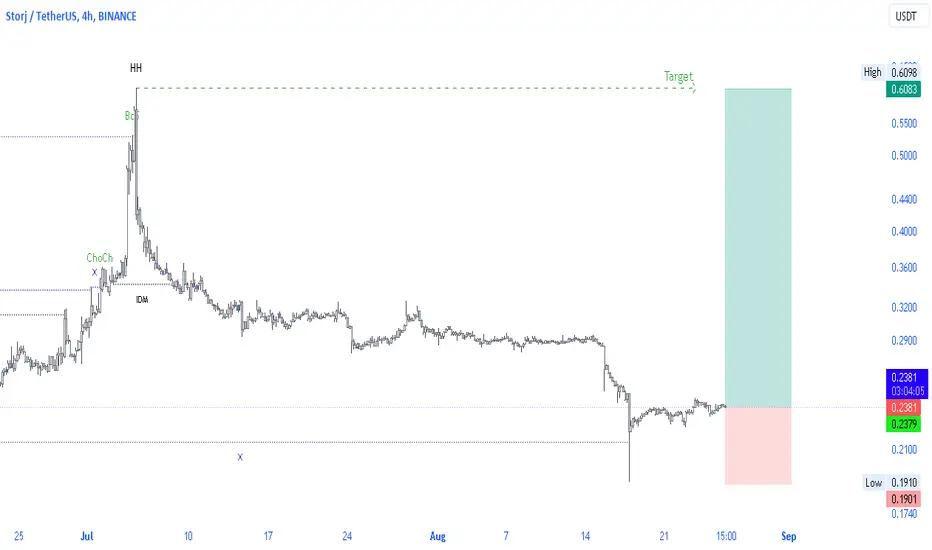
Storj end of cicleEnd of cicle for Storj, 100% of wave 1 done, 5 waves completed. Price at -90% discount
3PML 3PWL 3PDL

Storj Buy Trade. Here is My Study zon Storj.
Welcome to my channel! Here you'll find daily technical analysis ofthe latest trends in the crypto market. From Bitcoin to altcoins, I'lIl be sharing my insights and predictions to help you make informed decisions
about your investments. Follow me for the latest updates and join the conversation in the comments!
Crypto technical analysis uses past price history to predict future price. It's not a guarantee and shouldn't be relied on solely for investment decisions. Consider other factors such as market trends, economic strength and
information dissemination. Use with caution.
This Is Not A Finacial Advise

🚀 STORJ/USDT chart on the H4 🚀
🚀 Hey there, fellow traders! Let's take a look at the STORJ/USDT chart on the H4 timeframe. 🕰️
It's looking bullish! 📈 The price has broken above the previous structure's low, suggesting some serious upward momentum. 📈
🎯 Our target? 🎯 It's set on the last structure's high. If the trend continues, that could be our ticket to gains! 💰
🔍 Remember to keep an eye on key factors like trading volume, broader market conditions, and potential resistance levels. 📊
⚠️ And of course, risk management is crucial! Set your stop-loss levels to safeguard your trade in case the market throws a curveball. ⛑️
🔄 Market vibes can change quickly, so stay vigilant and adapt as needed. Keep an eye on those charts! 📉📈
Happy trading! 🌟📊🚀
Remember, emojis add a fun touch, but always prioritize your trading strategy and analysis. Good luck! 🍀📈
✴️ This Storj Support Level Leads To 150% Bullish WaveStorj vs Tether (STORJUSDT) is bouncing off a very strong support level. Each time this support level is hit a 150% bullish wave takes place, this already happened twice this year.
Now, this time around we are seeing a bounce/recovery happen right above this support level, which is an indication of strength.
Going by past action, Storj is very likely to produce a new bullish wave. The growth can be similar to what it was before but it can also be bigger, due to the higher low.
The previous dates were January 2023 and June 2023.
Other Altcoins are showing early recovery signals and others growing.
Invalidation: If the support level marked here with a blue line breaks on a weekly basis, this analysis becomes invalid. This level can be used as a stop-loss.
Namaste.

STORJUSDT Long/ShortAt good boy position
Add here...
NAFA
ITS JUST MY IDEA
DYOR n take ur positions...
ThankYou

Storj price pumping. What next ?Over the past two weeks, the price of STORJUSDT has increased by +180%.
Why they decided to pump this particular coin is a mystery to us, it's just an old, unremarkable project.
But if you know something more, please write about it in the comments.
But there is one regularity: a year ago, in mid-June, there was a similar STORJ pump, followed by a long price drop with a new low.
We believe that this year's STORJ price will not update its low more. However, the chance to participate in the pumping and make money on it has already been missed, as the price has been pushed too high without a thorough good correction.
The probability that STORJUSDT may face a protracted and exhausting correction with a final target of $0.275-0.32 is quite high, this is -40%.
And then everyone decides for themselves what to do with the information we have shared)
_____________________
Did you like our analysis? Leave a comment, like, and follow to get more
