STORJUSDT trade ideas


storj could rally 50%I see a potential descending triangle breakout on STORJ, which could take it to the top for around a +50% gain. I say "could" rally 50% because we are in very uncertain economic times and anything could happen... but when you take all the noise away and just look at the price action, this looks decent for a long.


STORJ WHALE IVStorj has gained great volume on the load-zone. The asset has the potential to start a new bullish swing towards its major resistance labeled as R1 and in case of a violation, it can swing to the following targets.
previously...
Storj Whale
Storj Whale II
Storj Whale III

STORJ shark pattern to $1#STORJ/USDT
$STORJ broke out from descending resistance and confirmed it as support and can complete SHARK pattern between $0.93 and $1

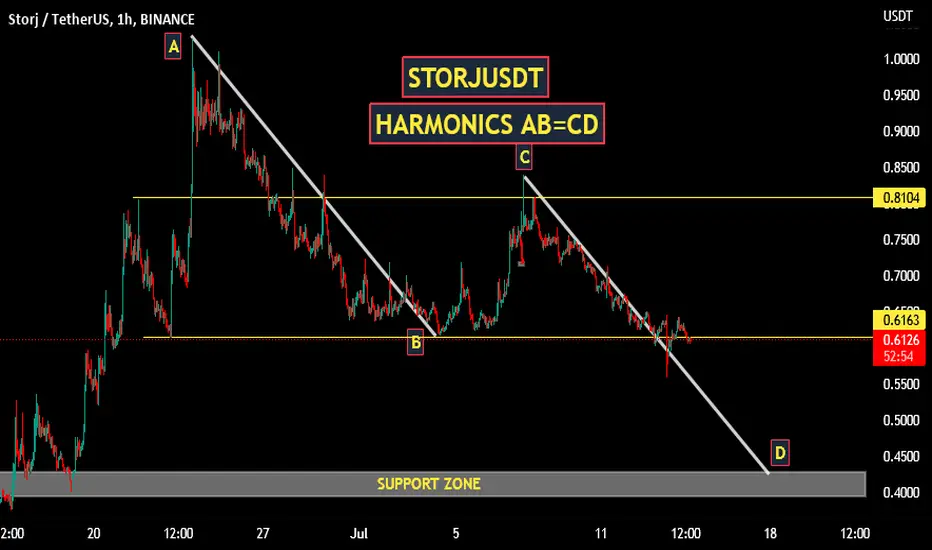
STORJUSDT | HARMONICS AB=CDSTORJUSDT is in a bearish trend. When we plot AB=CD Harmonic on the chart, the price action may fall to its previous strong support zone. Where a double bottom will be also formed.
Currently the price action is at support level and break of support will call more bears.
Trade your levels accordingly.
STORJ | TRIANGLE BREAKSTORJ after 50% retracement has finally managed to break the triangular pattern. bulls seems to be incharge for now for the upside targets.

STORJSTORJ/USDT im waiting price to come in my support zone to make Tripple Bottom nad to LONG coin after breakout confirmation
Disclamer:
We are not financial advisors. The content that we share on this website are for educational purposes and are our own personal opinions

STORJ/USDTSTORJ/USDT
It can have another ascending LEG.
It can correct up to Fibo 68 and 38 and start its upward trend from there.
On the other hand, it has an upward divergence and a break in its internal trend line.
#STORJ #STORJUSDT #BTC #BTCUSD #LUNA #LUNC #UST

Small short to take liquidity in STORJ - Cryptoz18█ Operation Information
STORJ is a highly volatile asset so keep this in mind when trading. We are currently getting a bit of a pullback after a strong bull run, there are a number of bullish orders at 0.7567 so I will take a little short.
█ Operation data
• Entry price: 0.7653
• StopLoss: 0.7797 (Loss 1.88%)
• TakeProfit Minimum: 0.7567 (Win 1.12%)
• Recommended margin: 5% of the Futures account
• Recommended leverage: 1x.
• Temporality: 15Min - 4H
✔️ Data: The user is recommended to move the StopLoss to entry once we reach the TPM or also known as the Minimum TakeProfit.
In this way, if the trend is good for a longer timeframe, it will never touch the StopLoss placed on our entry. We will only have to pay the commissions in case we get the SL at the entrance.
Being a 15-minute trade looking to take a 4H trend it is likely to have a fairly low Winrate due to the tight StopLoss however this offers us better risk management. We try to take a 4H trend using SL and TPM of 15 minutes.
This way, we seek to obtain a profit of 100% between all operations. Only 5% of the account per operation could achieve our objective and thus obtain a return of 5-7% per month of the total account. This will be reflected at the top of our profile.
█ Global data to take into account
Bitcoin is currently in an uptrend in 4H. However, a lot of bearish orders trying to keep it below the 20500 prices. The daily trend is in play, take your precautions.
█ Warning
✔️ Cryptocurrency operations represent a high risk. Therefore, this operation should not be taken as an investment recommendation. All I do is share my trading ideas publicly for the viewer to do their own analysis and decide to enter based on their own decision-making. The viewer is recommended to have good risk management in their operations. For this, take into account fundamental data from the Volume of the asset, Marketcap, Supply, Percentage change price, Current Volatility, Perpetual Data and finally, proper Margin and Leverage management Be careful, you can lose all your money in the future if you have poor risk management. Nothing more to say thank you very much.

$STORJ.7050 entry would be sweet , monthly btc pairing looks interesting with it on the verge of breaking downtrend
so assuming corn is chilling this should move to a $1 pretty quick also where we have the 200 on the D1 so flip that retest go to yellow line

💡Don't miss the great buy opportunity in STORJUSD @storj
Trading suggestion:
". There is a possibility of temporary retracement to the suggested support line (0.6426).
. if so, traders can set orders based on Price Action and expect to reach short-term targets."
Technical analysis:
. STORJUSD is in a range bound, and the beginning of an uptrend is expected.
. The price is below the 21-Day WEMA, which acts as a dynamic resistance.
. The RSI is at 56.
Take Profits:
TP1= @ 0.7233
TP2= @ 0.8009
TP3= @ 0.8735
TP4= @ 0.9924
TP5= @ 1.1641
SL= Break below S2
❤️ If you find this helpful and want more FREE forecasts in TradingView
. . . . . Please show your support back,
. . . . . . . . Hit the 👍 LIKE button,
. . . . . . . . . . Drop some feedback below in the comment!
❤️ Your support is very much 🙏 appreciated! ❤️
💎 Want us to help you become a better Forex / Crypto trader ?
Now, It's your turn !
Be sure to leave a comment; let us know how you see this opportunity and forecast.
Trade well, ❤️
ForecastCity English Support Team ❤️

STORJUSDT - SETUPSTORJUSDT price trying to negate the downtrend by showing some positivity. We are expecting some good upside move towards some near-term resistance areas. So keep following the price action.


#Storj/ #USDT : Analysishello? Traders, welcome. If you "follow", you can always get new information quickly. Please also click "Like". Have a nice day!. ---
Note that trend line is very important in technical analysis and most traders trade with trend line failure.
The same thing happened in the storj / usdt chart
- The trendline is broken and pullback is done

Storj go to the Moon 🔥Most of my indicator are showing the bullish move in upcoming day.
If it will break 0.74$ level, we'll see a rally to 1$, because every time we saw macd up cross, after that we have seen significant growth.
Furthermore in terms of examining patterns, we have a reliabe double bottom pattern in 4H TF.

STORJ/USDTSTORJ / USDT
The third approach to dynamic resistance.
From the resistance of 0.85 returned, the possibility of falling to the range of 0.27 cents is not out of reach.
#STORJUSDT #STORJ #BTCUSDT #BTC #ETHUSDT #LUNA #LUNC


Storj BUy
May you profit alooooooot
I pray for your well being.
Regards
Love from Malaysia
NB/ Don't shoot blindly

3 Black Crow on STORJUSDT## Use:
Bearish Candlestick pattern: May predict reversal of uptrend.
## Identification
1. Open: 2nd and 3rd candle patter should open in/ near the previous candles real body.
2. Close: 2nd and 3rd candlestick pattern should close lower than the previous.
3. Three candle sticks close near / at the lower.
4. Condition: Either top of an uptrend or rally.
## Market Psycology
1. In a typical appearance of three black crows, the bulls will start the session with the price opening modestly higher than the previous close, but the price is pushed lower throughout the session. In the end, the price will close near the session low under pressure from the bears.
## Risks
1. The size of the three black crows candles and the shadow can be used to judge whether the reversal is at risk of a retracement.
2. Pattern completes only after closing of 3rd candle. So, market might have corrected substentially and may even reverse and go in uptrend direction.
The three black crows pattern and the confidence a trader can put into it depends a lot on how well-formed the pattern appears.
The three black crows should ideally be relatively long-bodied bearish candlesticks that close at or near the low price for the period. In other words, the candlesticks should have long, real bodies and short, or nonexistent, shadows. If the shadows are stretching out, then it may simply indicate a minor shift in momentum between the bulls and bears before the uptrend reasserts itself.
Ref: (www.investopedia.com)
## Additional Confirmation
RSI , <30 ( oversold )
Support & Resistance regions.

STORJ price movement predictionSTORJ .. enter on support bounce... once it breaks above weekly - it will be in LOW VOLUME NODE territory .
Market Cap 341.7M
DYOR ( do your own research )
price movement prediction
Price Prediction
not financial advice
this is for entertainment purposes only
always DYOR
