STORJ/USDT Buy Setup: Breakout with 1:3 Risk-to-Reward PotentialWe’ve identified a compelling buy opportunity on the STORJ/USDT pair based on the following observations:
Break of Structure: The RSI (200-period) has confirmed a breakout, signaling a potential shift in momentum.
Engulfing Candle: A strong bullish engulfing candle indicates a robust buying interest.
Volume Spike: The significant increase in volume further validates the buying pressure.
Trade Parameters:
Entry: 0.5232
Stop Loss: 0.4497
Target: Resistance level at 0.7269
This setup offers a favorable Risk-to-Reward (RR) ratio of 1:3, making it an attractive trade opportunity. The confluence of technical factors and the RR incentive strengthens the case for this trade.
Ensure alignment with your trading strategy and risk management rules before execution!
STORJUSDT trade ideas

STORJ LongCup and handle pattern, currently in the handle phase, but we will need to breakout fvg first before entering, doing miss out

STORJUSDT 1WSTORJ ~ 1W
#STORJ If you still have Conviction on this coin,. This support block would be a very good buying place for now,. Buy in stages with a minimum term target of 20%++

StorjWeakly best buy in 36$ ...38$
If buy in the price... Please buy 3 level....
Target 1.90$
1 level In the market price 60$
2 level In the 41.24$
3 level in the 38
But not price 38$
Not bearish storj

StorjWeakly best buy in 36$ ...38$
If buy in the price... Please buy 3 level....
Target 1.90$
1 level In the market price 60$
2 level In the 41.24$
3 level in the 38
But not price 38$
Not bearish storj

STORJBreakout above 1$ can lead in rally , dyor and potentially fill your bags if you feel like risking before break out

Storj building a mad moveStorj loves to make a big run, has the look of a coin priming itself for a mega move.

Storj at bottom of ascending channelStorj price came down to what looks like the bottom of this ascending channel and has reacted to a key support level. Possible swing long entry if price retraces but remains bullish.


Storj / UsdtBINANCE:STORJUSDT
📊 Storj (STORJ) Price Analysis – Bullish Signs and Key Levels 📈
The current price of Storj (STORJ) is 0.4681, showing some bullish potential 🚀. Here's a breakdown of key support and resistance levels:
🔰 Support Level: 0.4201 – If the price holds above this level, it suggests buying interest and potential for upward movement 📉➡️📈.
🚧 Resistance Levels:
0.4920 – The first resistance level, where selling pressure might appear 🛑.
0.5757 – A stronger resistance zone. A breakout above this could signal further bullish strength 💪.
If the price holds above these key levels, there's potential for it to rise to the 0.6000 – 0.7000 zone 📈.
🔮 Bullish Outlook: If Storj breaks through resistance, the next target could be 0.6000 – 0.7000, indicating more upward momentum 🎯.
⚠️ Disclaimer: This analysis is purely informational and not financial advice. Always do your own research and consult with a professional financial advisor before making any investment decisions 💼.

STORJ / USDT Set for a Bullish Breakout! Key Targets in Sight!STORJ/USDT Technical Analysis:
On the 1-hour timeframe, STORJ has confirmed a long trade entry at 0.4484. The bullish momentum is backed by the Risological Dotted Trendline , which signals a strong upward trend. This setup shows potential for a series of target achievements as the price inches closer to critical profit levels.
Trade Summary:
Entry Level: 0.4484
Target Levels:
TP1: 0.4800
TP2: 0.5310
TP3: 0.5820
TP4: 0.6135
Stop Loss: 0.4229
With initial target levels approaching, STORJ’s momentum could bring gains as it heads toward the upper profit marks. Watch for further bullish action!

STORJ-USDT Technical AnalysisThe price of STORJ is in a downtrend and has been trading within a descending channel since March 2024, with the price consistently making lower highs. This downtrend is defined by a descending channel upper trendline that has acted as resistance multiple times and a lower trendline acted as support. Recently, the price has started to push upward, and this upper boundary of the descending channel is being tested again, suggesting a potential test of the downtrend resistance.
Several key support and resistance levels are visible on the chart. The most immediate resistance lies in the descending channel upper boundary, $0.3937 level, with a resistance zone (Green) at $0.4299 - $0.4420 just above. If the price manages to break through here, it could target higher resistance levels, such as $0.4947 the major resistance zone (Pink) at $0.5830 - $0.6110, and so on, all the levels are marked in the chart. These levels have historically seen strong selling pressure.
On the downside, strong support (Purple) at $0.3420 - $0.3501, where the price recently found support and began its current upward movement. Further support zone (Yellow) at $0.3003 - $0.3099 and the ultimate low at $0.2584, which acted as a base for a previous bounce. If the price fails to break resistance, it could retrace to these lower levels.
Overall, STORJ/USDT is at a critical juncture. A break above the downtrend and key resistance zones would indicate a potential shift in momentum to the upside. However, failure to break these levels could result in a continuation of the downtrend, with price retesting key support zones. The next few days will be crucial in determining the future direction of the pair.
Everything is on the chart

bullish??A fractal breakout of 481 and a pullback is a signal to enter a long position/the target is the Fibo range of 50 to 62

STORJ / usdt. Buy setupHell guys. Price is reaching discount zone so becareful and DONOT ENTER TRADES WITHOUT CONFIRMATION
I am more bullish on storj now so buyers will come
BUY ZONE SHOWN FOR YOU BUUUUUT ALWAYS DYOR

STORJUSDT.1DSTORJ/USDT daily chart, several significant technical elements shape the current market landscape, offering insights into possible future movements.
Key Observations:
Resistance Levels: 'R1' at $0.6089 is currently the key resistance level. The price action around this level in the past suggests it could be a significant barrier to upward movements.
Support Levels: The price is currently testing the support level 'S1' at $0.3971. Below this, additional supports are at 'S2' ($0.3097) and 'S3', providing further levels where the price could potentially find a floor if declines continue.
Price Dynamics: There was a recent sharp rise followed by a corrective pullback to 'S1', suggesting a volatile market where traders are actively testing both supply and demand zones.
Technical Indicators:
Stochastic RSI: The Stochastic RSI is extremely low, indicating the asset is potentially oversold. This could presage a bullish reversal or at least some form of price stabilization in the near term.
MACD: The MACD is below the signal line and negative, suggesting that bearish momentum is currently dominant. However, the histogram shows a reduction in bearish momentum, which could indicate a potential shift.
Strategic Approach: Given the oversold condition indicated by the Stochastic RSI and the testing of support at 'S1', this could be a pivotal area for traders to watch. If 'S1' holds, it may present a good buying opportunity with a potential target at 'R1', especially if other indicators such as the MACD begin to show signs of a bullish crossover.
Conversely, a break below 'S1' would necessitate caution, as it could lead to further declines towards 'S2'. In such a scenario, adjusting stop-losses and reassessing market sentiment would be crucial. A defensive strategy might be warranted, with close monitoring of the lower support levels for signs of stabilization.
Conclusion: The STORJ/USDT pair is currently at a technical juncture with the potential for both recovery and further declines. The key will be the asset's ability to hold above 'S1'. Traders should remain vigilant, considering both the oversold condition and the prevailing bearish momentum. As always, keeping a close eye on further indicator developments and market news will be crucial in navigating the market effectively. Sound risk management strategies will be essential in managing the inherent volatility of the market.

Looking for long on STORJ looking for a swing long if price reaches the highlighted area as it represents a demand zone on the daily and weekly timeframe.

Storj / UsdtBINANCE:STORJUSDT
"Currently, Storj is showing signs of consolidation. If it holds above the resistance level of 0.5734, we could see it move toward the next resistance levels at 0.6587 and 0.7500. However, if it doesn't hold and drops below 0.4977 or 0.4565, those could act as support levels. Remember, this isn't financial advice—always do your own research and assess the risks!"
That way, you’re providing useful insights while reminding everyone to be cautious!

Storj BINANCE:STORJUSDT
"Currently, Storj is showing signs of consolidation. If it holds above the resistance level of 0.5734, we could see it move toward the next resistance levels at 0.6587 and 0.7500. However, if it doesn't hold and drops below 0.4977 or 0.4565, those could act as support levels.
Remember, this isn't financial advice—always do your own research and assess the risks!"
That way, you’re providing useful insights while reminding everyone to be cautious!

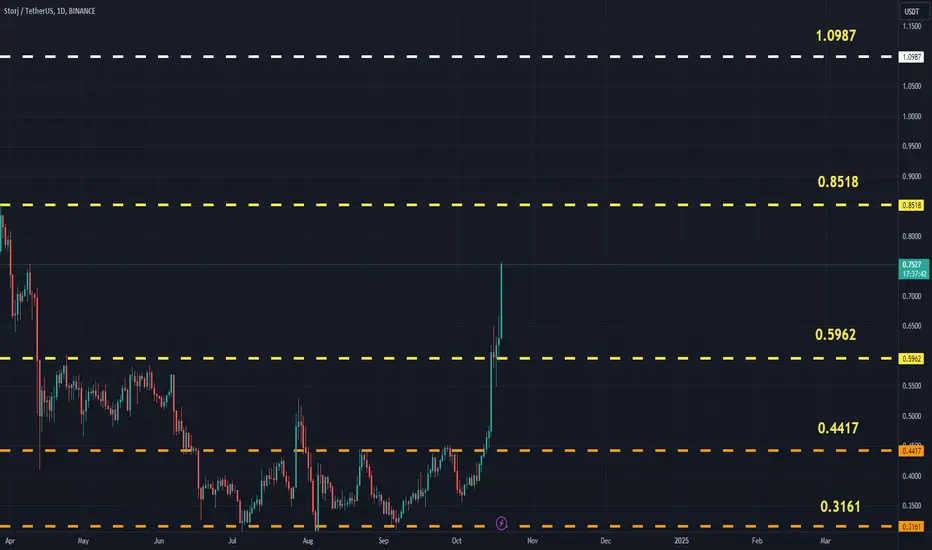
STORJUSDT (Storj) Updated till 19-10-24STORJUSDT (Storj) Daily timeframe range. pushing hard from its local low. not far away from its mid 0.8518 resistance. there are not much of holdup if volume dont drops it can continue. recent support at 0.5962.
$STORJ longThe coin has traveled all the way to its destination. Now I expect correction to the zone from 0.4455 to 0.3812. This is the level of position set and return to the zone from 0.6065 to 0.6765.
For myself, I decided that I will take a short on the movement to the set zone from 0.6199 to 0.4455

Storj / Usdt BINANCE:STORJUSDT
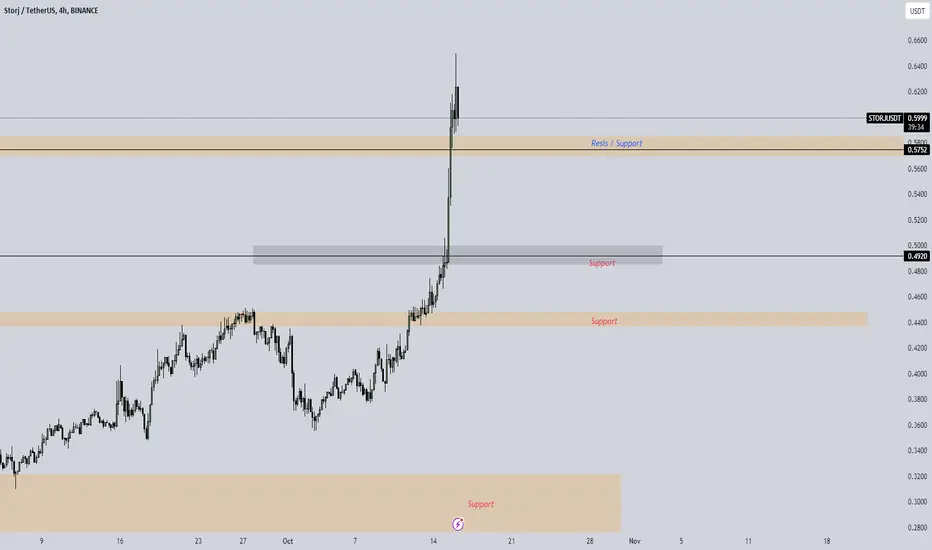
🚀 Storj Update! 🚀
Currently, Storj is priced at $0.5995 and has successfully broken through its resistance level, which has now turned into a support area at $0.5734. If the price holds above this support, we could see the next resistance at $0.7000.
However, if the price fails to maintain the current level, the next support zones to watch will be $0.4920 and $0.4400.
As always, remember: this is not financial advice! Stay informed and trade wisely!
Storj is still bullishstorj was making a falling wedge chart pattern thats a bullish indication, and had made successful breakout from the trend and now it is facing its first strong resistance at 0.6$ but it is making strong consolidation below resistance that is also a bullish indication, The over all target as per this breakout is 0.820.83$, it might also face resistance at 0.74$.
