Sell StorjUsdtHello Traders!
This is a sell Trade of StorjUsd
Stoploss is 3.3% and the target will give 13% gain of the Investment.
Don't forget to hit the like button and follow to Stay connected
STORJUSDT trade ideas

STORJ - Neutral for now!STORJ is the second hottest coin on Binance right now with more than 9% price change.
Support: As shown on chart
Resistance: After the closure of the first 4H candle you can open your long positions and aim for that TP area I've shown on the chart.
Use this setup to open your positions and please be careful.
Current Market Price: $0.8454
Good Luck
Tell me your ideas. Like and Share


Let's go LONG ;)By observing a divergence in the CCI indicator and also breaking the descending trend line, the shown target can be reached soon.

STORJUSDT DESCENDING TRIANGLEAll info has been put in place on chart, be sure btc is in good condition before going for a long position. All target will follow fib values, I'd appreciate your reviews and likes.
Follow me for more helpful contents.


STORJ broke out resistance$STORJ broke out long term descending resistance, price can increase to $1.2 in short term

STORJUSDTHello to you all. Mars Signals team wishes you high profits at all times.
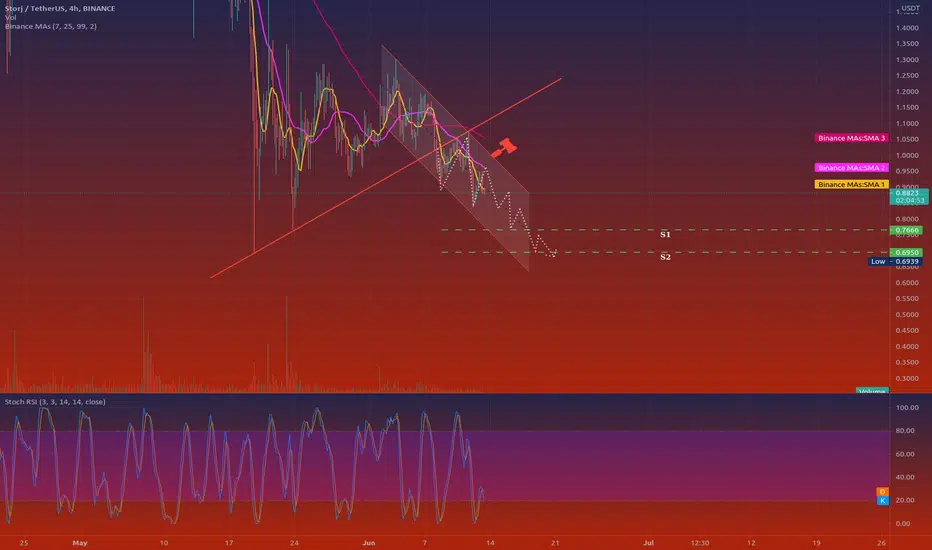
We are in a 4 hour time frame. As you can see, the price of the support channel line has lost and a pullback has hit its support level and has fallen. In our opinion, if it can not climb above its channel line, we still predict the fall to the support level.
Warning: This is just a suggestion to you and we do not guarantee profits.
Wish you luck!
Great setup incoming Forming a bullish falling wedge pattern with Major support within the .30-35 cent range and up to 3x ROI. Please DYOR. As always, this isn’t financial advice

Storm jAttempting to pull watch BtC did and get back into its ascending triangle it broke from. Let’s see if it can get back above 1.02 and hold here. This would be a damn good run as it held the lower support I expected and didn’t post about Unfortuently A small wick below that was bought back around .93cents.


StormjI’ve been posting about storm in UsD but I am trading it in USDT. As for the update. It is in the same symetrical traingle as bitcoin and Ethereum and my others. As it recently tapped 1.30 and jejwctes hard I was looking for support around 1.09. As it dipped to 1.04 I saw it there could of gotten purchase however to be safer I waited for support back on 1.09 where I entered. As we break 1.1083 we continued to see some
Holds there. The next major resiatnce short term is 1.1435. As far as a very safe entry if you don’t want to play inside this consildation which is easy to get wrecked without proper stoploss, a break of 1.30 and confirmed support I’m looking for 1.82$. This would retest an old breakdown of a pattern we fell from before. Will be interesting to see how she does. Obvisouly this will follow BTC


Great Setup on StorjUsdtWait for breakout confirmation and take positions - Bullish Sentiment is strong but if turns bearish, We will be prepared for that too. Have a good day and dont take it as FA

1st day of Summer!Get ready to become rich, folks🔥
There is one more interesting formation on crypto market.
Symmetrical triangle on STORJ crypto pair.
According to Elliott Waves theory Wave D is done and now price is heading to Wave E.
However this formation may become circumcised and break the level earlier.
So follow the chart and look for the breakout carefully.
_____________________________________________________
If you enjoy my FREE Analysis , support the idea with a big LIKE👍 and don't forget to SUBSCRIBE my channel, you won't miss anything!
Feel free to leave comments✉️
And always remember: "we don't predict, we react".

$STORJ - #OdinZone identified. The first zig zag (A) down from 3.81 was pretty violent and retraced the full .618 and then some. I feel like the dip isn't over until we hit the .786. BTC's final move on wave 4 could coincide with the end of this correction and the bounce could be massive. I'm setting the Odin Zone for this coin between a previous resistance and the .786. It also coincided with a pre-wave 3 resistance.


