STORJUSDT 2D: XABCD 1000% gains(HIGHLY SPECULATIVE)Why get subbed to me on Tradingview?
-TOP author on TradingView
-15+ years experience in markets
-Professional chart break downs
-Supply/Demand Zones
-TD9 counts / combo review
-Key S/R levels
-No junk on my charts
-Frequent updates
-Covering FX/crypto/US stocks
-24/7 uptime so constant updates
STORJUSDT 2D: XABCD 1000% gains(HIGHLY SPECULATIVE)
IMPORTANT NOTE: speculative setup. do your own
due dill. use STOP LOSS. don't overleverage.
🔸 Summary and potential trade setup
::: STROJUSDT 2days/candle chart review
::: XABCD BULLS in progress now
::: BUY LOW point D / PRZ
::: entry - late December
::: up to 1000% gains possible later
::: short-term BEARISH
::: up to 60% downside from here
::: HIGHLY SPECULATIVE SETUP
::: do your own due dill
::: and use proper risk management
::: TP bulls is +1000% gains later
::: details: see chart
::: FINAL TP is 0.0275
::: recommended strategy: BUY/HOLD after correction
::: TP BULLS +1000% gains
::: SWING TRADE: BUY/HOLD IT
::: bull run not over yet
::: good luck traders!
::: BUY/HOLD and get paid. period.
🔸 Supply/Demand Zones
::: N/A
::: N/A
🔸 Other noteworthy technicals/fundies
::: TD9 /Combo update: N/A
::: Sentiment mid-term: BULLS
::: Sentiment short-term: BEARS/CORRECTION
STOUSD trade ideas


Still looking bullish after today's market dumpThe current situation:
1. Price action had previously broken out of the bigger falling wedge, with a measured target of about 0.76 USD. Currently, it is apparently still ranging in a symmetrical triangle pattern with a measured target of 0.6 USD, while not being affected by the bearish action in the market today. Please note that the measured target may or may not be reached.
2. The last high it made at about 0.76 USD has created a very high RSI reading on all major timeframes. So if the price action reaches another high of 0.76 or above, it can mark bearish divergence unless the RSI reading will be higher on these timeframes. And if the bearish divergences play out, that can signal a pullback.
*Thank you to those who donated, I very much appreciate it.
*Let me know in the comment section if you agree or disagree, would love to hear your ideas too.
*These are purely my speculations and not financial advice. You should always do your own due diligence before trading or investing.

Bullish signs but pull back expected at THESE levelsThe current situation:
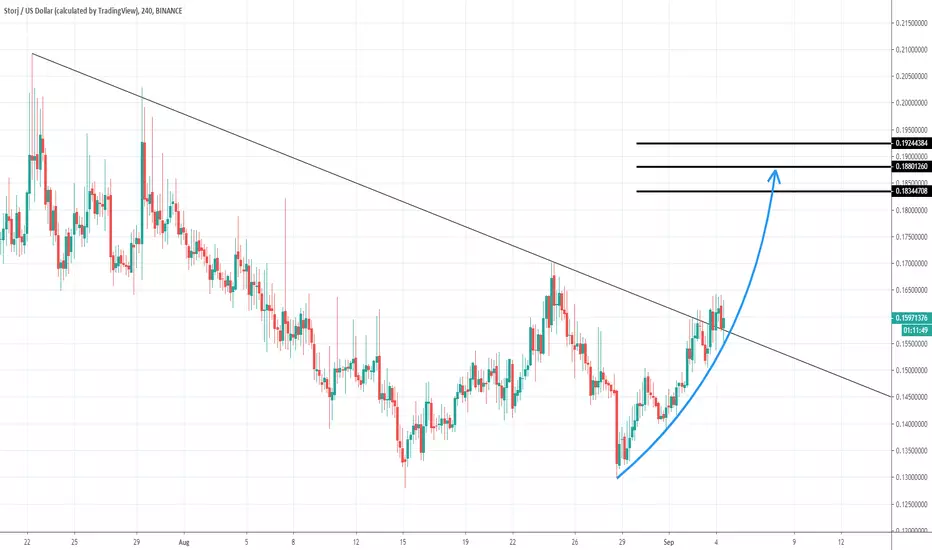
1. Price action previously broke out of the falling wedge pattern with a measured target of about 0.77 USD. Currently, it is apparently ranging in a symmetrical triangle pattern between the breakout point and the measured target while being above all moving averages on major timeframes, which is a bullish signal.
2. Possible bearish divergence can occur on the 4 and 6HR chart when price action reaches or beats the last high within the symmetrical triangle at about 0.52 USD without making a higher high on the RSI, which can signal a pullback.
Possible bearish divergence can also occur on all major timeframes if price action reaches or beats the last high from the falling wedge at about 0.745 USD without making a higher high on the RSI, which can also signal a pullback.
*Thank you to those who donated, I very much appreciate it.
*Let me know in the comment section if you agree or disagree, would love to hear your ideas too.
*These are purely my speculations and not financial advice. You should always do your own due diligence before trading or investing.

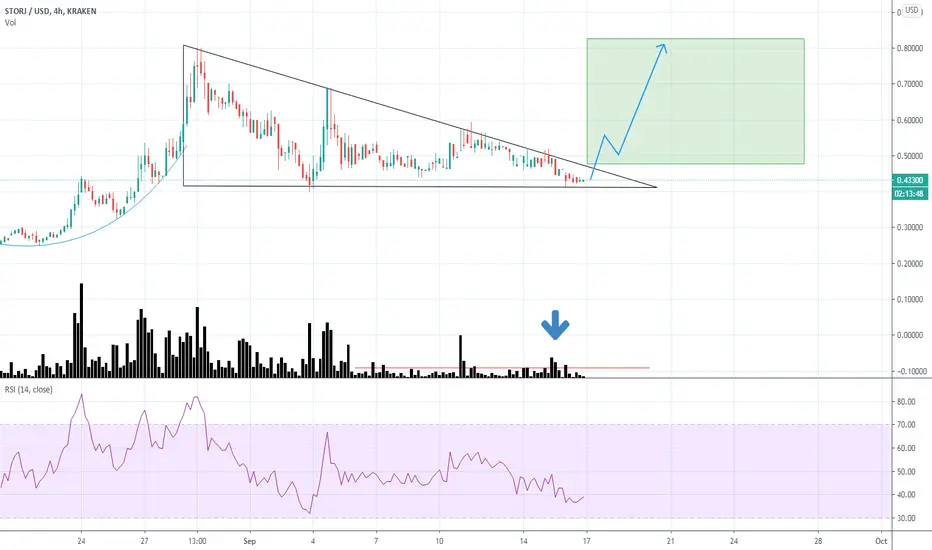
Storj/usd to go up -As we can see from the chart there is a descending triangle forming on the uptrend, indicating a possible bullish break through.
-In addition volume has began to pick up recently as shown in the chart
-I suspect BTC will be declining slightly in the coming days allowing alt coins to receieve more buying pressure
I am not offering financial advice these are just my ideas on the matter


STORJ Pushing Higher - Short TermIts a good buying opportunity, obviously short term. However, if the final upside target is broke, price is likely to go much higher.
At the same time Storj is likely to outperform Bitcoin
Looking for a new GEM 4 ( shit coin in crypto ) Bought my own bag ( that I sold in November) . Hold as long as it stays above the support-line.
WHAT I LEARNT 2 YEARS OF TRADING IN THIS CRYPTO MARKET!
1 ) Weekly open –close above MA 20 ( bullish trend)
Weekly open –close below MA 50 ( Bearish trend )
Super Bullish : The candle is above MA 20 ( Daily )
Bullish : MA 50 Above MA 100 ( Daily )
Bearish : MA 50 below MA 100 ( Daily )
2) If it breaks the daily trend line with a strong candle, it is the easiest buy / sell signal.
3 ) If your main job is trade ( making the money to survive - cover the cost of living ) , dont focus 1 minute , 5 minutes, 15 minutes, 45 minutes charts! Never!
Only check 4 hour / 1 day / 1 week in crypto!!!
When the break came almost all of the crypto coins had been hurt or fractured. It was now a question of estimating how sick the cryptos were and how long their sickness would last. I reasoned that if a crypto has fallen from 10 to 1, it will almost certainly not climb up to the same high again for a long, long time. It was like an athlete with a badly injured leg who would need a long period of recuperation before he could run and jump again as before.
Target? The charts speaks itself!

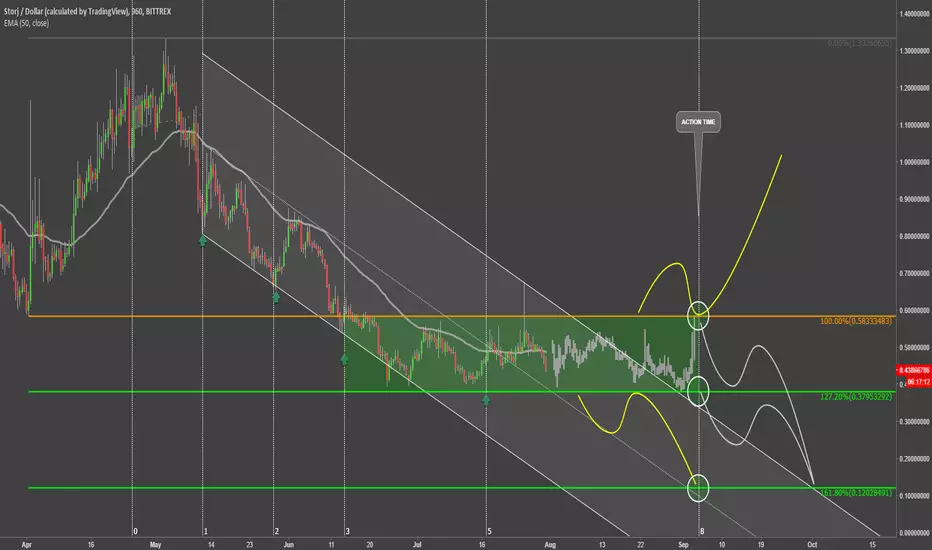
Storj Coin Action TimeStrorj has been steadily declining since 3rd of may, and already lost 70% to the USD. Price has moved down from $1.33 to the $0.4 low. STORJ/USD almost reached the 127.2% Fibonacci support level at $0.38, but failed to couch it.
In any case trend remains bearish as price still moves within the descending channel, and recently rejected the upper trendline, suggesting the continuation of the downtrend. At the same time it seems that currently price started to consolidate, between $0.4 support and $0.55 resistance.
The range trading could continue, but the interesting timing is the 4th of September, which is 8th period of the Fibonacci Time Zone indicator. Around that day, price might start showing some signs of a trend which could help to reveal further direction.
There are multiple scenarios that should be expected, but only break above the resistance or below the support could be the trigger for the next STORJ move.
If $0.38 support is broken, price is likely to go down further, to test 161.8% Fibs at $0.12. But if the resistance is broken, this might be the first sign of a potential trend reversal.

STORJ - The Next BIG Gainer?Storj Coin has been trading at the price of $0.5 for quite some time, but after the rally started back in October price has reached an all-time high, hitting $3. The corrective wave followed where Storj lost back to the USD over 80%, while the correction was stopped by 88.6% Fibonacci retracement level which was rejected cleanly.
The price of Storj remains undervalued, considering the facts that the current price is only $1 while the total supply is only 500,000,000 SJCX, and the price has been trading on lows for an extended period of time.
However, there are very strong resistance levels, that have to be broken in order for Strong to starting producing heavy gains. First resistance is at $1.56, and second $1.78. Break above the second resistance should confirm a very bullish scenario for the Stong and could push price x10-20 in the midterm.
On a downside. break and close below the $0.6 support could invalidate bullish outlook.


Nice cup and handle formation on #STORJGreat pattern that has huge potential to rise..
Buy in: 1.50 - 1.60
Target 1 - 2.10
Target 2 - 3.85
Target 3 - 4.70

STORJ is coming! Storj may have a fall back before going to its 3rd position.
This year is a really great year for cryptos! Will have ups and downs but we should go with the flow.
3rd wave: $5-7
4th wave: may come back to retest the $2.50 range (I've done wrong in my Elliot wave) 'Sorry bout that'
5th wave may go further than $10.
Remember to get few percentages of profits before it goes retesting and then as I said, go with the flow.
We won't have to handle about emotions if we are trading based on TAs :)

STORJ Trend breakpointEither it rises back up for 30 percent gain or starts a downtrend. Watch carefully.

STORJUSD +550% target $15.73, Buy OpportunitySTORJ/USDT available on Huobi Pro from 18:00, January 9, 2018(GMT+8).
Rocket Is Almost Ready for Lift Off..
STORJUSD

