One Last Drop Before Take Off?Price is still in a pullback phase, and the next potential target zone is around 0.07488 – 0.07334.
We might see one last dip before BINANCE:STPTUSDT resumes its uptrend.
If the price reaches this pullback zone with a bullish divergence, that would be a strong confirmation for a possible reversal
Related pairs

Spot Signal for Weekly Cycle, STPTUSDTSpot Signal for Weekly Cycle, STPTUSDT
These are spot signals suitable for the 2025 investment strategy.
I use a multi-timeframe trend analysis system combined with a structure-based system. The monthly timeframe is currently in an uptrend, and as of now, the monthly trend (M) is still ongoing.
I

Standard Tokenization Protocol Easy 200%+ TargetThis chart has the bullish breakout, the correction, the shakeout, the rounded bottom, the recovery, the volume and all the classic signals combined plus more. This chart is bullish now and bullish means... Oh, oh! Easy double-up.
You can put in 1 Bitcoin and end up with 3 Bitcoins within just a fe


STPTUSDT – One of Today’s Highest Volume Gainers!🔴 Key Resistance Zone:
The red box marks the first major resistance area, where sellers are likely to step in aggressively. This is where weak hands get trapped, and smart money makes its move.
📉 How to Trade This Like a Pro:
✔ Short Bias: If price rejects from this zone, I will look for lower time

Trading opportunity for STPTUSDTBased on technical factors there is a Buy position in :
📊 STPTUSDT
🔵 Buy Now
🪫Stop loss 0.04200
🔋Target 0.06450
📏 R/R 3
💸RISK : 1%
We hope it is profitable for you ❤️
Please support our activity with your likes👍 and comments📝

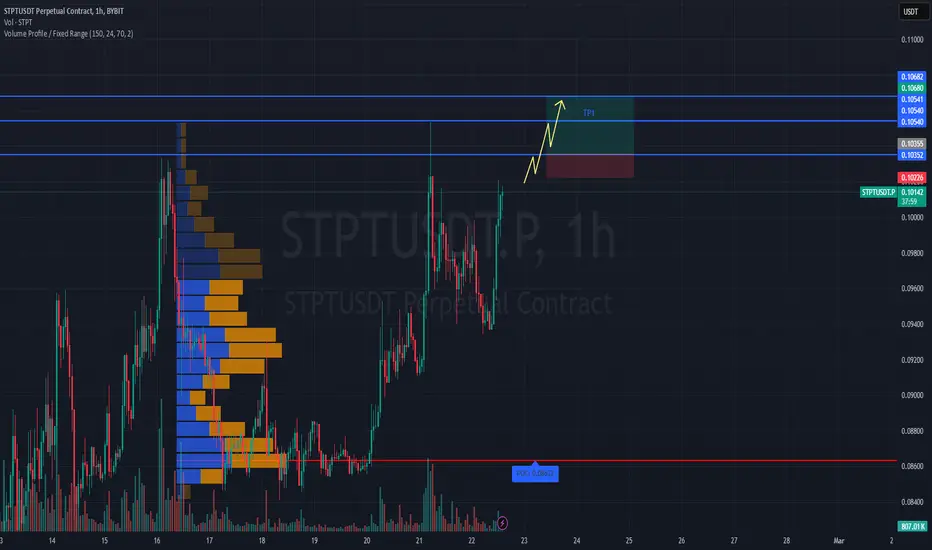
#STPTUSDT maintains bullish momentum📈 LONG BYBIT:STPTUSDT.P from $0.10355
🛡 Stop Loss: $0.10226
⏱ 1H Timeframe
✅ Overview:
➡️ BYBIT:STPTUSDT.P is showing strong bullish momentum after consolidating at lower levels, indicating buyer presence.
➡️ Volume Profile suggests that the main liquidity (POC) is positioned significantly be
Corrections Are Good, For TA: STPT Can Do An Easy 100%The correction here reveals that all the selling has already been done. And this is good, because once the selling is over we can expect prices to grow.
This pair, STPTUSDT, can easily give 100% without considering a new high.
A new high will happen because we have a higher low and we are in bull-m

STPT/USDT Long Trade Setup – Key Levels
**🚀 📊**
- **SL (Stop-Loss):** 0.09744 🔴
- **Entry:** 0.11060 🟡
- **T1 (Target 1):** 0.12922 🟢
- **T2 (Target 2):** 0.14908 🟢
👉 Confirm price support and breakout continuation before entering. Manage your risk effectively! 💹
#STPTUSDT #CryptoTrading #LongTrade #TechnicalAnalysis #Tradi

STPTUSDT (STP) Updated till 15-01-25STPTUSDT (STP) Daily timeframe range. we can see 2 wicks toward 0.08291 thats buyers trying to clear out sellers on resistance. if retail interest keeps up its not hard to get over 0.08291. its holding well even through market dump till now. recent support at 0.06287.

See all ideas
Summarizing what the indicators are suggesting.
Oscillators
Neutral
SellBuy
Strong sellStrong buy
Strong sellSellNeutralBuyStrong buy
Oscillators
Neutral
SellBuy
Strong sellStrong buy
Strong sellSellNeutralBuyStrong buy
Summary
Neutral
SellBuy
Strong sellStrong buy
Strong sellSellNeutralBuyStrong buy
Summary
Neutral
SellBuy
Strong sellStrong buy
Strong sellSellNeutralBuyStrong buy
Summary
Neutral
SellBuy
Strong sellStrong buy
Strong sellSellNeutralBuyStrong buy
Moving Averages
Neutral
SellBuy
Strong sellStrong buy
Strong sellSellNeutralBuyStrong buy
Moving Averages
Neutral
SellBuy
Strong sellStrong buy
Strong sellSellNeutralBuyStrong buy
Displays a symbol's price movements over previous years to identify recurring trends.
Frequently Asked Questions
The current price of AWE/TETHERUS (STPT) is 0.07042 USDT — it hasn't changed in the past 24 hours. Try placing this info into the context by checking out what coins are also gaining and losing at the moment and seeing STPT price chart.
AWE/TETHERUS price hasn't changed in a week, the last month showed zero change in price, and as for the last year, AWE/TETHERUS has increased by 60.34%. See more dynamics on STPT price chart.
Keep track of coins' changes with our Crypto Coins Heatmap.
Keep track of coins' changes with our Crypto Coins Heatmap.
AWE/TETHERUS (STPT) reached its highest price on Jan 26, 2025 — it amounted to 0.15187 USDT. Find more insights on the STPT price chart.
See the list of crypto gainers and choose what best fits your strategy.
See the list of crypto gainers and choose what best fits your strategy.
AWE/TETHERUS (STPT) reached the lowest price of 0.03010 USDT on Apr 7, 2025. View more AWE/TETHERUS dynamics on the price chart.
See the list of crypto losers to find unexpected opportunities.
See the list of crypto losers to find unexpected opportunities.
The safest choice when buying STPT is to go to a well-known crypto exchange. Some of the popular names are Binance, Coinbase, Kraken. But you'll have to find a reliable broker and create an account first. You can trade STPT right from TradingView charts — just choose a broker and connect to your account.
Crypto markets are famous for their volatility, so one should study all the available stats before adding crypto assets to their portfolio. Very often it's technical analysis that comes in handy. We prepared technical ratings for AWE/TETHERUS (STPT): today its technical analysis shows the buy signal, and according to the 1 week rating STPT shows the buy signal. And you'd better dig deeper and study 1 month rating too — it's buy. Find inspiration in AWE/TETHERUS trading ideas and keep track of what's moving crypto markets with our crypto news feed.
You can discuss AWE/TETHERUS (STPT) with other users in our public chats, Minds or in the comments to Ideas.