Will STX Outperform Bitcoin?In the crypto market, if you want to beat the market, your benchmark is $CRYPTO:BTCUSD. That means to outperform the crypto market, you need to outperform Bitcoin.
One way to measure this is by watching crypto/BTC pairs, such as $BINANCE:STXBTC. If $BINANCE:STXBTCgoes up, it means STX is stronger than BTC. If it goes down, BTC is stronger than STX.
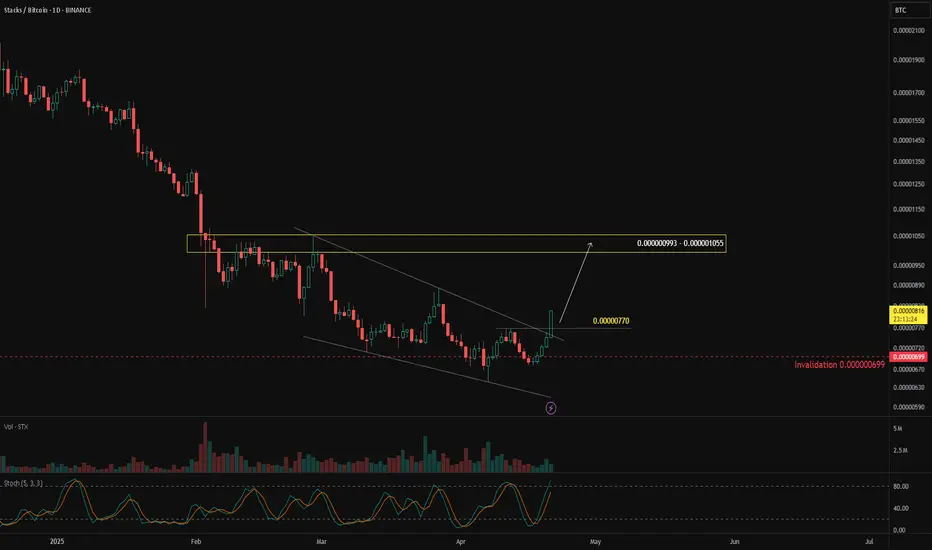
On the daily chart, BINANCE:STXBTC has been moving downward, but over the past month, sellers seem to be losing momentum—indicated by a falling wedge reversal pattern.
A bullish breakout above 0.000000770 would confirm the pattern, with a potential upside target at 0.000000993 – 0.000001055. This scenario remains valid as long as price holds above 0.000000699.
STXBTC trade ideas
Stacks/Bitcoin Bullish PotentialStacks/Bitcoin pair is at the lowest is has been since its last capitulation phase. It usually bounces from here and this low signals another bullish uptrend.
Looking at the demand zone at the bottom we can see there is a good opportunity to buy the lows from 0.000012 satoshis and HODL until mid to high 0.000045 satoshis, making 4x+ on your Bitcoin.

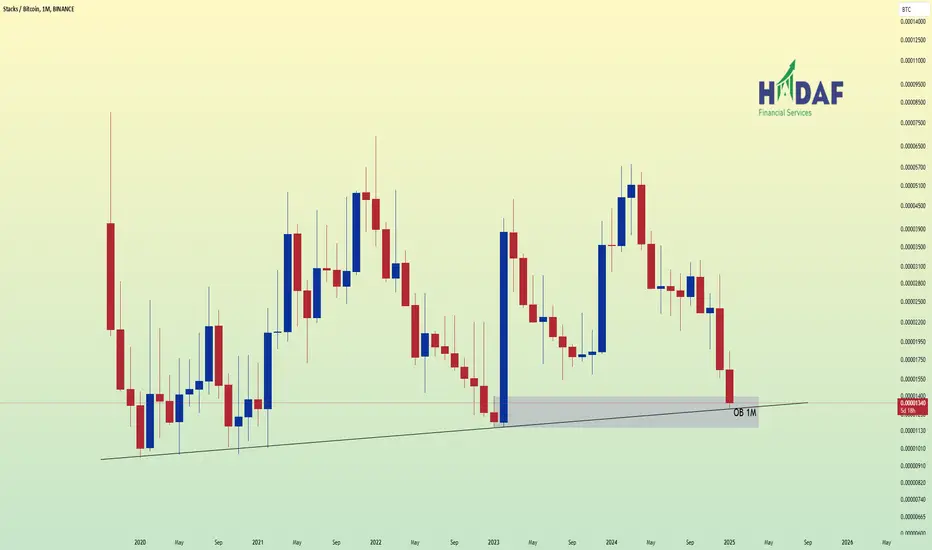
#STXBTC chartNo need for further explanation. The BINANCE:STXBTC chart is on a monthly order block that has pumped the price up heavily in the past. Also, the dynamic trendline has always been a good support for the price. We will see if it can do the same this time.
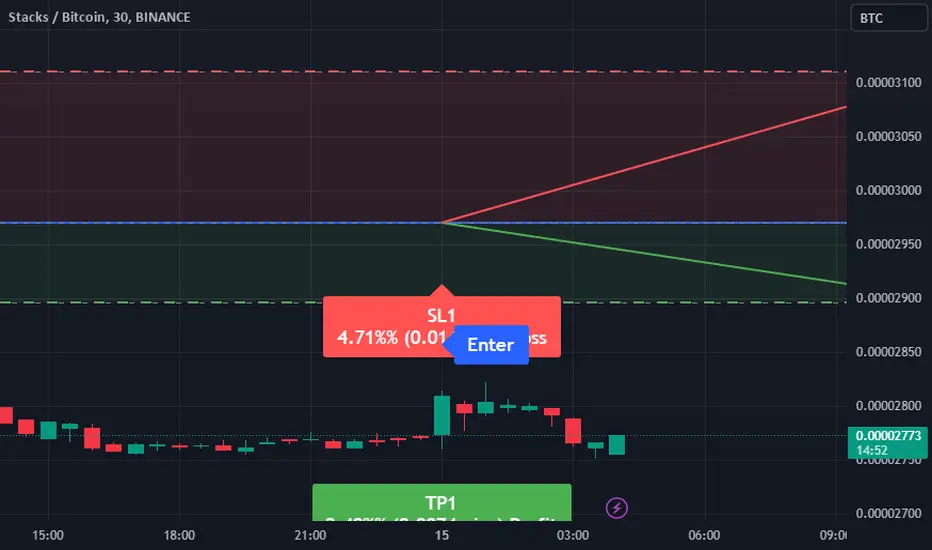
Trading Signal for STXBTC PairDirection: Sell
Enter Price: 2.97E-05
Take Profit: 2.896E-05
Stop Loss: 3.11E-05
Analysis and Justification:
This trading call is generated using the EASY Quantum AI strategy, which uses sophisticated algorithms and multiple technical indicators to assess the market conditions.
The decision to sell STXBTC is influenced by several key factors:
1. Resistance Levels: Recent market activity has shown the currency pair struggling to break through the resistance around the 3.00E-05 mark. This suggests a potential downward correction.
2. Volume Analysis: Diminishing volumes have been observed, indicating a decrease in buying momentum as the pair approaches our entry price, which supports the likelihood of a bearish move.
3. Moving Averages: Short-term and mid-term moving averages are showing bearish crossover signals, which further reinforce our decision to enter a sell position.
4. Macro Trends: The broader market sentiment and macroeconomic indicators are suggesting a risk-off environment, making high-beta assets like STXBTC more vulnerable to downward corrections.
These indicators collectively support our bearish outlook on STXBTC for the near term. Please ensure to monitor the market closely and adjust your positions as necessary, taking into account that trading involves substantial risks.
Stacks | Basic Technical Analysis Predicts Bullish WaveFor the market to be bullish and to continue bullish, it must produce higher lows, so we expect Stacks to end its correction higher now than the low it hit in November 2023; makes sense?
➖ In January 2023 STXBTC produced a strong bullish wave. This up-move led to a correction and the correction can only end in a low. This low happened in November 2023 and this low is higher than the low that was hit before the start of the bullish wave in January 2023.
The same pattern then repeats.
➖ In November 2023 STXBTC starts a new strong bullish wave. This up-move leads to a correction and the correction can only end in a low. This low happened recently, early August (5-Aug. 2024) and this low is higher than the low that was hit before the start of the bullish wave in November 2023.
➖ Higher highs and higher lows. That's what you just read above.
This means that we have a bullish trend.
We draw two trendlines: One on top and one at the bottom.
When the top of the trendline, channel, is hit, prices move down.
When the bottom of the trendline is hit, prices move up.
Now that the lower trendline has been challenged, we can assume that prices will move up. This is only an "assumption." Prices don't necessarily need to move up but this is technical analysis, we use past action to predict the future.
Thanks a lot for your support.
Namaste.


STX Retesting support on price and RSIRecently STX broke its longterm resistance and now it will try to make it a support. With all the panic in the market it should come down to the old resistance area and should bounce from there. Same with RSI as we can see it has long-term support line and it is very close to it. Practically price should fall slightly from here which will also bring RSI close to its support line and should bounce from there. Keep an eye on overall market, if sentiments remain negative STX might break the support and take a nose dive. Be Alert!!

STX strategy against BTC (Y24.P1.Video1). Some surprisesHi Traders,
It came to my attention that maybe I should trade STACKS #STX with BTC in mind every time.
Along the way, I found another reason to short BTC at 54.500 k range and hence STX might be a better choice.
Here are the reasons.
Please give me a like and share.
Cheers.
S.SAri

STXBTC - Prepare for a 13-25% dropBitcoin is consolidating for a potential big move up.
In the meantime, STXBTC is barely holding the upper VWAP line.
If/when Bitcoin starts a bull run, there's a chance people move into BTC.
Just keep an eye out.
BINANCE:STXBTC

STACKS looks likely to move down | Bitcoin STXBTCStacks STXBTC looks likely to pull back toward it's VWAP fair value as Bitcoin profit taking continues.
BINANCE:STXBTC
The daily candle for STXBTC has fallen below the short-term VWAP over-bought line and is bouncing off of the trendline as support. The trendline is also the same level as the long term VWAP over-bought line.
Look for the price of STXBTC to bounce between these two levels until it breaks in a direction.
MACD look very bearish for the short term making it appear likely that it tests the short-term VWAP fair value (white line) around .00003000.
If it fails to hold the short-term white VWAP line, look for it to fall even more and test the long-term VWAP fair value line around .00002500

Falling wedge STXBTCThis is ehe moment, the most bullysh signal ever.
Everything is explained in the chart

✳️ Stacks vs Bitcoin (100%+ Potential Easy)This chart is a bit different than the one we just looked at, Optimism but still the same, let me show you.
We have a higher low 10-July vs 10-June, this is a short-term higher low.
Yesterday Stacks (STXBTC) closed above EMA10 and today it is growing above this level.
We already experienced the initial bounce from the June low that leads to a small peak and then the correction ending 10-July and this leads to the next high which is what I am mapping for you today.
This is easy and also it will be fast.
100% potential but there can be more depending on the pair.
This will be a nice and strong Cryptocurrency bullish wave.
Everything will grow... It is exciting.
It can be profitable too.
Namaste.

✳️ Stacks vs Bitcoin Long-Term | Complete Cycle MappedHello my dear Cryptocurrency trader, let me show you why I am bullish on Stacks vs Bitcoin long-term.
November 2022 marks the "All-Time Low", left side of the chart. After we hit bottom, the only place left to go is up and this leads to a massive bull market.
A bull market leads to a bear market and this is also clearly marked on the chart.
The bear market most come to and end by hitting a new low and in this case a long-term higher low (January 2023 higher low vs November 2020 all-time low).
Between June 2022 and January 2023 is the "consolidation phase", same as Bitcoin and the rest of the market and then comes a bullish breakout, recovery, the new bullish phase and it starts with 333%.
Such growth needs a correction, now taking place, a "steep correction" on the chart... This correction will lead to a new bullish wave, the continuation of the initial breakout. This is true for the ENTIRE CRYPTOCURRENCY MARKET.
Thank you for reading.
Namaste.

Stx long ideaStx really weak for now in btc pair. But as you can see in graph, 4 hours rsi giving us positive mismatch. Thats why i believe that stx can go up near future.
Entry 0.8548
Stop 0.8225
Target 0.96

✳️ Bullish Continuation = Bullish Confirmation | Stacks New HighSTXBTC (Stacks) hit a peak in late February to end a 285% bullish wave.
We would normally expect a correction at this point as usual but no.
The week late Feb. closed as a shooting star, a bearish candlestick pattern which was followed by a hammer.
So prices did move lower but all losses were quickly recovered and STXBTC managed to close green, after green and now... Continues green.
A new week and a new high is being hit.
A very strong bullish continuation.
This is not bear market type of action.
Bullish continuation = bullish confirmation.
Cryptocurrency is in a long-term growth path no doubt about that.
We have higher lows since early 2020 and we will continue to experience higher lows and higher highs, for years to come.
Namaste.

The Altcoins Bull Market | Proof In The NumbersHere we have Stacks, STXBTC, producing some serious growth, some really nice numbers.
This is bull-market type of action; let me explain.
From early January to 20-February STXBTC grew by 200%.
In a bear market, this type of move would happen much faster in the form of a short-squeeze.
As soon as the peak is hit, we would immediately see a major crash that would lead to a lower low.
Currently, after 20-Feb. we have little consolidation followed by additional growth.
STXBTC is hitting new highs, including a new high today for a total of 285% since the last low.
The more it grows...
The longer this bullish wave continues, the stronger the upcoming higher low.
This is bull-market type of action.
Based on what we are seeing now, when the major correction comes we will end up with a higher low.
Higher highs and higher lows... That's bull-market action.
It has been happening for a while now.
Adapt and change.
There is room for additional growth.
Namaste.

Blockstack (STX) vs BTCHere's a project that's so new I can't even show you a 1-day chart. Read all about here: blockstack.org
There's two reasons I'm interested:
1) The project's focused on decentralising the web, i.e. unstoppable websites, no government can block information as the internet was first intended. It is an opportunity to get into a project at a ridiculously early phase that has relevance for every user of the internet.
2) We're at the end of a bear market with a new project. Ethereum did something very similar when first launched to the masses, trading at the end of a bear market. What I'm looking out for is:
> Majority of trading volume is through Binance - yes
> Not a copy of any other Blockchain - yes
> Not more than 4 months old - yes
> High use case - yes
Blockstack ticks all of the above boxes. That's worth a punt in my book.
On this 4-hr chart we've now have support on the upper Bollinger Band with re-tracement fast approaching .78 Fibonacci level.

✳️ Mapping A 125% Bullish Wave for StacksWe have a neat and clear downtrend starting June 2022 for STXBTC but as November approaches we can see lots of bullish action.
This action is supported by high bull volume on green days but as prices decrease the bear volume is low.
This signals we belief is saying that the downtrend is coming to an end and the bullish action that became evident in November was due to some purchase being made by whales.
Are we early to the party?
We will know soon enough...
We see a 44% jump once the breakout happens and the bullish wave can reach 125% initial within 1-2 months.
There is higher potential long-term.... But we have to start somewhere, we go step by step.
Additional details on the chart.
Namaste.

✳️ Stacks 113-293% Potential Supported by Strong SignalsSometimes we see a chart and spot some signals and even while reading the signals as bullish and seeing them confirmed some small doubt remains... This happens when the signals are not strong enough.
In fact, we can go through the whole analysis and at the end just STOP! and visit that doubt again... With STXBTC, this is not the case.
Now, the signals here are very strong.
The volume is absolutely high and it has been growing day after day which is better than it showing up by surprise in a single day.
Today STXBTC has the highest volume Since November 2022 and if we ignore this day, today has the highest volume since January 2022... That's a very strong bullish confirmation as this volumes comes as STXBTC moves above MA200, telling us it is getting ready to grow long-term.
The low/bottom here happened in 22-January 2023, while Cryptocurrency grows together, ALTSBTC + ALTSUSDT, they have a slight delay between each set, when one moves forward, the other one is going sideways or correcting but when the group that is more advanced takes a break, the other group jumps up with massive force to catch up.
- The RSI at 77 is super strong.
- The MACD just entered the bullish zone, with plenty of room available for additional growth.
Everything is pointing higher.
The conservative target is 113%.
The mid-term target is set at 293%.
We see Altcoins growing by 100% and 200% in a single day.
While I share these numbers conservatively, remember that the cryptocurrency market is wild and growth can be many times higher than what I am sharing everyday.
Since we are not greedy, we are grateful and happy with any and all positive results, we keep the numbers tight but when trading, we aim high up.
Namaste.

$STX/#BTC [#Stacks]: TrendLine_TouchWe've detected a Trend Line Touch on the $STX / $BTC chart. The price has touched a key resistance level, indicating a potential trend reversal. The next resistance key levels are at 0.00001504 | 0.00001652 | 0.00001914 and the major support zones are respectively at 0.00001242 | 0.00001128 | 0.00000866, We may consider buying at the current price zone at 0.00001455 and benefit from the trend continuation.
Technical Metrics :
Current price: 0.00001455
24H Volume: 53.6255 Ƀ
24H Price change: 9.563%
- Pivot Points - Levels :
Resistance: 0.00001504 | 0.00001652 | 0.00001914
Support: 0.00001242 | 0.00001128 | 0.00000866
Indicators recommandation :
Oscillators: NEUTRAL
Moving Averages: STRONG_BUY
Technical Indicators Summary : BUY
- In-depth STXBTC technical analysis on > Tradingview TA page
What do you think of this analysis? Share your insights and let's discuss in the comments below. Your like, follow and support would be greatly appreciated!
Welcome to the home of charting big: TradingView
Benefit from a ton of financial analysis features, instruments and data. Have a look around, and if you do choose to go with an upgraded plan, you'll get up to $30.
Discover it here

$STX/BTC is about to explodeBuying volume is increasing and Bollinger Bands are really tight, and that means it's getting volatile.
STX is currently trading in my buying zone for 3 months. It's the 0.618 en 0.65 Fibonacci retracement from the last impulsive wave 1.
From Stacks' market history, it can be seen that stacks has a habit of showing explosive price rises.
As Bitcoin continues to move between 20k-24k and loses market dominance, it seems that this will give room for sats to rise significantly in value.
My expectation is that the 0.382 Fib will be a first point of resistance (2764 sats). Seen from the current price, this is a 45% increase in sats value.

$STXBTC huge break-out about to occurStacks is on a breakout. As previously mentioned in my analysis of last May 30, found at this link: Stacks is very interesting to take a long position in.
On the hourly chart, the Bollinger bands are hugely compressed. This shows that there will be a huge breakout, and in my opinion, upwards. I'm expecting an upward move because stxbtc has set a very nice bottom at the 0.618 Fibonacci retracement.

STX/BTC currently trading in the golden pocket rangeSTX/BTC is STX/BTC is currently trading in the golden pocket range on the weekly chart.
The divergence script for many indicators indicates two clear bullish divergences.
Chris Moody's script 'CM Williams VIX' which finds market bottoms, flashes obvious green.
LazyBear's Squeeze Momentum Indicator indicates a momentum change due to the first colour change from red to dark red.
The sell volume has been decreasing for months.
RSI is below 40.
MACD is a lagging indicator but when you switch to a 2/3day timeframe there is already crossover. My expectation is that this will soon follow on the weekly chart.
