STXUSD: One more green week and then correction.This is a direct update to our initial long signal on Stacks (see chart at the bottom), which is so far going according to plan. It just turned overbought on the 1D timeframe (RSI = 72.109) but it is the 1W that is of more concern, which is extremely overbought (RSI = 87.916, MACD = 0.253, ADX = 61.042) and this is why we are doing today's analysis on the 1W timeframe.
Our TP = 2.5000 remains but after that we expect a strong correction as not only is the 1W RSI the most overbought in history, but we are about to experience the first ever 1W Golden Cross, which would be a good opportunity for the market to take profits. The downside target is the 0.618 Fibonacci level (TP = 1.20000).
See how our prior idea has worked:
## If you like our free content follow our profile to get more daily ideas. ##
## Comments and likes are greatly appreciated. ##
STXSUSD trade ideas

STX Price Teases Breakout Rally Beyond $2!Diagonal Consolidation Range: STX shows a consolidation pattern in the 4-hour chart with diagonal boundary lines.
Current Market Sentiment: A general bearish trend in the market, with Bitcoin and Ethereum showing declines.
Resistance at $1.79: STX is currently facing resistance at the $1.79 level, a key point for potential breakout.
Potential for a Bullish Breakout: If STX breaks above $1.79, there's a strong possibility of entering a high-momentum bullish phase.
Support from Ascending Trendline: The price has been supported by an ascending trendline in the 4-hour chart.
Indecision in the Market: Lack of clear volume support for either bullish or bearish direction, leading to a sideways trend.
Intraday Growth: STX is showing positive signs with a 1.41% growth in a generally bearish market.
Technical Indicator - RSI: RSI indicates a potential for a comeback, currently supported at the halfway line.
Technical Indicator - MACD: MACD and signal lines are on the verge of a bearish crossover, indicating potential downside risk.
STX Price at Press Time: Trading at $1.69 with potential to test the overhead resistance soon.
Upside Target: If STX breaks through the $1.79 resistance, it could potentially target $2.00 and even $2.15.
Downside Risk: Failure to maintain momentum above $1.50 could lead to a retest of lower levels around $1.20.

Will STX Price Cross $1.75 Or Crash To $1.20?STX Price Lateral Shift: Currently, Stacks (STX) price shows a sideways movement, reflecting market indecision.
Sustaining Above $1.50: Despite volatility, STX holds above the crucial $1.50 mark.
Key Resistance at $1.75: STX faces significant resistance near $1.75, a pivotal barrier for further gains.
Bullish Recovery Risk: The recent 15% gain since the year's start is threatened by current market dynamics.
Volume and Volatility: A noticeable spike in trading volume aligns with marked price volatility, indicating active market participation.
Recent Price Pattern: A long-range Doji candle highlights the current indecisiveness in STX's price movement.
Current Trading Price: STX is trading around $1.5483 with minimal movement, suggesting caution among traders.
Selling Pressure at Higher Levels: Recent price actions show strong selling at higher levels, especially around $1.75.
Technical Indicator - RSI: The Relative Strength Index (RSI) dips below the overbought zone, hinting at a possible loss in bullish momentum.
Technical Indicator - MACD: The Moving Average Convergence Divergence (MACD) indicates a bearish trend with negative alignment.
Potential Bearish Breakdown: The possibility of a bearish breakdown increases if the price fails to sustain current levels.
Upside Potential to $2: If STX maintains above $1.50, there’s potential for an uptrend towards $2. However, failure to hold could lead to a drop to $1.20.

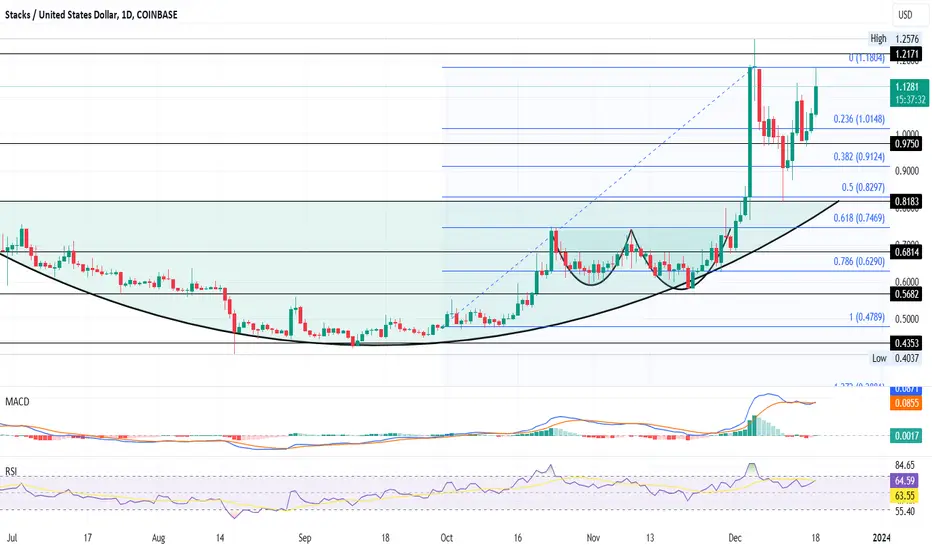
Quick Comeback for Stacks Teases A Bull Run To $1.50Sharp Comeback: STX price stages a strong recovery, testing the rounding bottom pattern successfully.
Recovery Rally: With a lightning-fast rally, STX rebounds above the $1 mark over the weekend.
Potential Breakout at $1.18: STX price hints at a breakout past $1.18, eyeing a target of $1.54.
Strong Start to the Week: STX opens the week with an impressive 8.98% jump, indicating a strong bullish trend.
Top Market Performer: Ranking high in top gainers, STX showcases significant investor interest.
Technical Indicators:
RSI Indicator: Demonstrates bullish dominance as it approaches the overbought zone.
MACD Indicator: Suggests an indecisive trend, despite being in the positive zone.
Rounding Bottom Pattern Retest: STX retests the 38.20% Fibonacci level and the $0.82 neckline, signaling robust market demand.
Bullish Uptrend Possibility: Current trading patterns suggest the potential for a new series of breakout rallies.
$STX almost 200% upside?COINBASE:STXUSD is one of my favorite looking charts for upside potential. STX, $ SYN $ XRP and $MASK are all charts that I've been looking at that haven't run yet.
Therefore, I think they'll be the next set of coins to run after BTC pulls back.
If we look at the chart, you can see STX has broken out of a massive bull pennant and now has formed a bull flag. As long as STX stays within the flag structure, then I lean towards one more move down to test the lows at $.58-$.59 before breaking upwards.
If this were to play out like this, then you can expect between 180%-200% gains from an entry at support. If it breaks upwards sooner than that, then I still expect the targets to remain, you'll just see smaller gains.
Let's keep an eye on this for the next week to see if we can nail and entry and exit.

STX Price Heads To The MOON, Targets $1.79!42% Surge in a Single Session: STX price experiences a remarkable 42% jump in one trading session.
Breakout Rally to $1.20: A lightning-speed breakout rally leads STX to surpass $1 and reach $1.20.
Potential to Reach $1.79: The STX price shows potential to climb to $1.79 before the end of 2023.
Reclaiming the $1 Mark: As previously predicted, Stacks has successfully reclaimed the $1 milestone.
90% Growth in Seven Days: STX demonstrates an impressive 90% growth in the past week.
Double Bottom Reversal: The price action indicates a double bottom reversal, triggering a bullish chain reaction.
Overhead Resistance at $1.21: STX is teasing a breakout at the overhead resistance of $1.21.
Support from Intraday Trading Volumes: The bullish trend is backed by rising intraday trading volumes.
Challenge to 52-Week High: STX is poised to challenge its 52-week high at $1.3250.
Current Trading Price: STX is currently trading at $1.2266, showing a 4.55% intraday growth.
Technical Indicators - RSI: The RSI indicates strong bullish momentum, crossing the 14-day SMA and nearing the halfway mark.
Next Resistance Levels: Post $1.32, the next resistance level is $1.79, beyond the psychological mark of $1.50.

STXUSD: Start of a parabolic rally.Stacks is rising after forming a Golden Cross on the 1D timeframe and turning highly overbought (RSI = 81.130, MACD = 0.059, ADX = 31.757). This comes after a major bullish breakout yesterday as the price crossed over the LH trendline of the December 1st 2021 All Time High. This indicates that the token has officially entered its new Bull Cycle and the onyl pattern that is emerging so far is a Channel Up.
Initially we expect this wave to target the 0.786 Fibonacci level (1.8700) and after a pullback, we will aim at the +535% total rise (TP = 2.5000).
## If you like our free content follow our profile to get more daily ideas. ##
## Comments and likes are greatly appreciated. ##

STXUSD Strong bullish extension short-term.Stacks (STXUSD) has closed above the 1W MA100 (red trend-line) for the first time since March 23 and even though it remains within an 8-month Channel Down, we expect to finally break it upwards as the 1D MACD formed the first Bullish Cross above the 0.00 level since since the start of the Channel Down itself.
To make the bullish case stronger, this is coming off the first 1D Golden Cross in 9 months and we can clearly see a technical Channel Up emerging. We consider this a strong short-term buy opportunity towards Resistance 1 at 0.886750.
-------------------------------------------------------------------------------
** Please LIKE 👍, FOLLOW ✅, SHARE 🙌 and COMMENT ✍ if you enjoy this idea! Also share your ideas and charts in the comments section below! This is best way to keep it relevant, support us, keep the content here free and allow the idea to reach as many people as possible. **
-------------------------------------------------------------------------------
💸💸💸💸💸💸
👇 👇 👇 👇 👇 👇

Is STX Price Ready To For Multiple Breakout Rallies?Double Bottom Reversal: STX showcases a double bottom reversal pattern in the daily chart, indicating an upward trend.
Rounding Bottom Formation: A long-term rounding bottom pattern signifies a potential breakout, aiming for a surge to the $1.25 mark.
Recovery Phase: STX ends a downtrend, breaking resistance levels, surpassing the 200-day EMA, and gaining over 81% in the last eighty days.
Uptober Season Bull Run: Buyers initiate a bull run during Uptober, with a 34% jump, sustaining demand pressure and forming a double bottom pattern.
Golden Crossover Influence: Uptrend above the 200-day EMA leads to a golden crossover, aiding the double bottom formation.
Current Price & Growth: STX trades at $0.7764, showcasing a bullish engulfing candle and a 7.29% intraday growth, indicating potential uptrend continuation.
RSI Momentum: Daily RSI shows increasing bullish momentum in the recovery rally, supporting the breakout possibility.

STX/USD Short-Term Bearish Projection
COINBASE:STXUSD
STX H&S, price action broke down below neckline and was rejected on the bearish retest. PA now seems to be caught between being rejected by neckline and supported by rising trendline. one of them will need to break one way or the other.

STXUSD above the 1D MA200 after 3 months!Stacks (STXUSD) broke above the 1D MA200 (orange trend-line) for the first time since July 20. Our target last time (see chart below) on September 19 was 0.65000, which is the 0.618 Fibonacci level:
The price is now on important crossroads. If the 1D candle closes above the 0.618, we will buy again and target the previous High at 0.89000. On the first closing below the 0.618 Fib though (or if it never closes above the 0.618 in the first place) we will sell and target the 1D MA50 (blue trend-line) at 0.52500.
-------------------------------------------------------------------------------
** Please LIKE 👍, FOLLOW ✅, SHARE 🙌 and COMMENT ✍ if you enjoy this idea! Also share your ideas and charts in the comments section below! This is best way to keep it relevant, support us, keep the content here free and allow the idea to reach as many people as possible. **
-------------------------------------------------------------------------------
💸💸💸💸💸💸
👇 👇 👇 👇 👇 👇

STXUSD Watch out for the 1D MA50 break-out!Stacks (STXUSD) has been trading within a Channel Down pattern since the March 20 High. Yesterday it made the first break-out attempt above the Internal Lower Highs, but closed back below it. At the same time it got rejected exactly on the 1D MA50 (blue trend-line).
A similar Internal Lower Highs trend-line dictated the first part of the Channel Down and after the 1D MA50 broke and closed a candle above it, made the Lower High at the top of the Channel Down on the 0.618 Fibonacci retracement level.
As a result, we will wait for the 1D MA50 to break in order to buy and target the 0.618 Fib at 0.65000. There is a high probability that it will make contact with the 1D MA200 (orange trend-line) on that level.
-------------------------------------------------------------------------------
** Please LIKE 👍, FOLLOW ✅, SHARE 🙌 and COMMENT ✍ if you enjoy this idea! Also share your ideas and charts in the comments section below! **
-------------------------------------------------------------------------------
💸💸💸💸💸💸
👇 👇 👇 👇 👇 👇

STX ABC correction .27-.40c entry Dollar Cost Avg. AreaNot financial advice
Follow,Like and Comment.
If you would like a personalized experience and insight please contact for a 1 on 1 assessment or a Ask Me anything.
Charts are made on current market conditions.
Currently looks like we are in an ABC correction on STX with the highlighted area is where we have area of interest.
You can also see the trendline on STOCH RSI that shows resistance and this downward triangle 📐 waiting for us to break out of it.
If we hold the current low we could complet similar to a big "W" over next 6-8 weeks.
Trade ideas moving forward
See if .40c area holds as support. And sprinkle in capital to DCA (dollar cost average) with a potential return of 1-2x from current levels
Lose .40c .27c be my max area of interest as we stand currently
Always remember to do you own research.
Always Practice Patience
#PIK Patience Is Key
#TLAW Think Like A Whale

STXUSD Buy break-out soon.Stacks (STXUSD) had a very strong 1D green candle yesterday and is about to hit the 1D MA50 (blue trend-line) for the first time since July 20. As the 1D MACD just completed a Bullish Cross yesterday, if the price closes a 1D candle above the 1D MA50, you can quick buy and target the 0.618 Fibonacci level. Further closing above it, would be a first, unlike the June 21 Lower High and we will take the break-out buy to target the 1W MA100 (red trend-line) at 0.81000.
-------------------------------------------------------------------------------
** Please LIKE 👍, FOLLOW ✅, SHARE 🙌 and COMMENT ✍ if you enjoy this idea! Also share your ideas and charts in the comments section below! **
-------------------------------------------------------------------------------
💸💸💸💸💸💸
👇 👇 👇 👇 👇 👇

STXUSD Making a strong bullish breakoutSTXUSD / Stacks crossed yesterday over the 2.5 month Channel Down and today over the 1day MA50 for the first time since April 14th.
This is second buy signal after the rebound 2 days ago on the 1day MA200.
Buy and target Resistance A at 0.82000.
If the price then closes a 1day candle above Resistance A and pulls back near the 1day MA50, buy again and target Resistance B at 1.010000.
Follow us, like the idea and leave a comment below!!

STXUSD near the bottom of its Rising Wedge.Stacks (STXUSD) had a Double Top rejection this week on its 1D MA50 (blue trend-line) and is approaching the bottom of the long-term Rising Wedge pattern. With the presence also of the 0.382 Fibonacci, this is the strongest buy signal since February 15. The 1D MA200 (orange trend-line) is right below it and the 1D RSI is close to the 30.00 oversold level. We are turning into buyers again, targeting the 0.786 Fibonacci at 1.80000.
-------------------------------------------------------------------------------
** Please LIKE 👍, FOLLOW ✅, SHARE 🙌 and COMMENT ✍ if you enjoy this idea! Also share your ideas and charts in the comments section below! **
-------------------------------------------------------------------------------
💸💸💸💸💸💸
👇 👇 👇 👇 👇 👇

STX - BREAKOUTSTX has a trend line breakout / retest after a double bottom @ the VPOC. Looking for STX to hold & climb from here. Stops below the DB.

$STX looking bullishCOINBASE:STXUSD is looking pretty bullish. As you can see on the chart, price has been consolidating in a falling wedge, and it looks like it's about to break out.
It could either go up here, or it could retest the $.75 region before heading higher. Either way, price looks like it wants higher.
I entered a position at $.7375. My bias leans towards the $.99 - $1.10 region as the short term top, then I could see price retesting this structure before heading much higher.

Stacks stacking channels on top of channelsJust retested the top trendline of the top channel and its currently resistance….may be a chance for it to retest the bottom trendline of the top channel again to reaffirm support. If so, if I see it confirm support on a retest of the 50 cent area I will pick some up. *Not financial advice*

Stacks is a buy and hold for at least the next half a yearStacks is the dominant smart contract layer for Bitcoin for now and perhaps long term. After the massive run up in $STC and $ALEX I'm looking to hold my bag and add considerably on any pull back. Returning to 97 cents is likely so I'll double my position at $1. Should it pull down to 77 cents I plan to double again. Falling all the way to the mid sixties I will double again. Each time doubling my total invested in Stacks.
I'm a long term holder on this project with the nice farming yields on $ALEX I don't mind waiting out any big corrections over the next two to three years. Potential major resistance at $1.32 and ATH around $2.42
Considerable breakout and close above $1.32 on the daily would force me to push in hard at that level. Likely run to ATH after that and potential to just blast through since the market cap is so low still. This project should trend toward 10 billion market cap similar to $ADA and other substantial projects. $10 loose target for long term growth

STXUSD Strong rebound on MA50 (1d). 1.7500 targeted.STXUSD is rebounding on the MA50 (1d) and Support (1) after a rejection 2 weeks ago near Fibonacci 0.618.
Golden Cross already completed 3 weeks ago.
Trading Plan:
1. Buy on the current market price.
Targets:
1. 1.75000 (under Fibonacci 0.786 and Resistance 2).
Tips:
1. RSI (1d) is on a Rising Support. It has accurately caught all three bottom buys.
Please like, follow and comment!!

1-Hour Order Block and Market Structure Break for $STXIt's a high probability setup with a decent return.

STXUSD Extremely high potential after 1D Golden Cross.Stacks (STXUSD) is on an amazing parabolic rally, having broken above its 1W MA50 (red trend-line). On top of that, the 1D MA50 (blue trend-line) and the 1D MA200 (orange trend-line) formed the Golden Cross, a technically very bullish formation for the long-term.
With the 1D RSI though hitting 90.00 (extremely overbought levels) and the price filling the 0.5 Fibonacci retracement level, it is more probable technically to witness a pull-back and medium-term sideways trading until the 1D MA50 at least makes contact. We are buying either on this pull-back or if the price breaks above the 0.618 Fibonacci first. The Channel Fibs draw an additional Channel framework to work within. Our target by the end of June is the 0.786 Channel Fib, at at least 2.5500.
-------------------------------------------------------------------------------
** Please LIKE 👍, FOLLOW ✅, SHARE 🙌 and COMMENT ✍ if you enjoy this idea! Also share your ideas and charts in the comments section below! **
-------------------------------------------------------------------------------
💸💸💸💸💸💸
👇 👇 👇 👇 👇 👇
