STXUSD stacking volumeSTXUSD OBV is so bullish that it looks like a data error, but all exchanges agree that big volume is coming in on green candles on every timeframe. There are some bigger buys coming in recently, and a successful test of long-term horizontal support over the last month. I am buying for the longer term and waiting for one of the high targets. Let's see what happens.
STXSUSD trade ideas

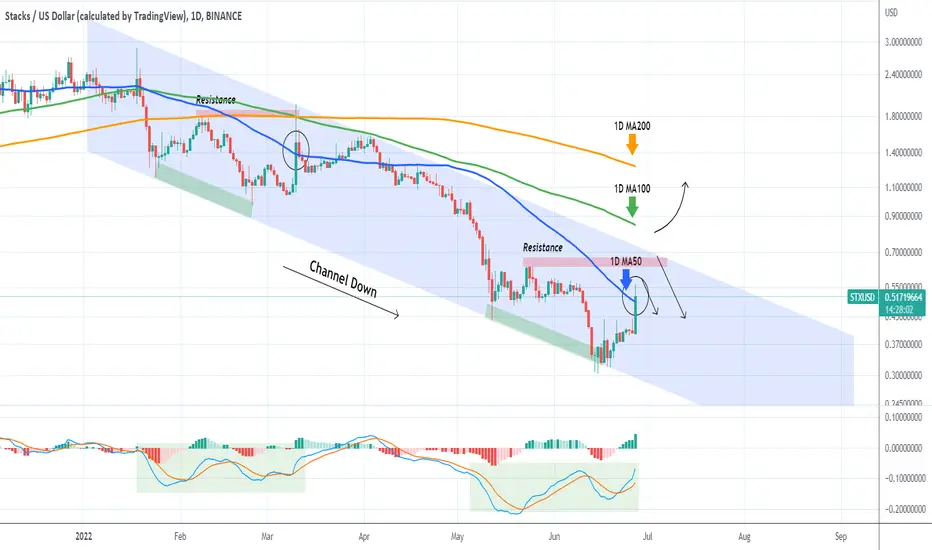
STXUSD Rebound contained below the 1D MA100Stacks (STCUSD) has had a +50% rebound on today's peak but we see the effect retracing as it almost hit the 1D MA100 (green trend-line). As long as it fails to close a candle above it, expect a Lower Low within the Channel Down pattern that it has been trading in since May 31. A break above the 1D MA100 targets the 1D MA200 (orange trend-line) which has been unbroken since January 21. A closing above it would still be limited to the top (Lower Highs trend-line) of the Channel Down but still a major bullish development for the long-term nonetheless. In order to sustain an uptrend in this case, the 1D MA50 (blue trend-line) has to be tested and hold as a Support.
-------------------------------------------------------------------------------
** Please LIKE 👍, SUBSCRIBE ✅, SHARE 🙌 and COMMENT ✍ if you enjoy this idea! Also share your ideas and charts in the comments section below! This is best way to keep it relevant, support me, keep the content here free and allow the idea to reach as many people as possible. **
-------------------------------------------------------------------------------
You may also TELL ME 🙋♀️🙋♂️ in the comments section which symbol you want me to analyze next and on which time-frame. The one with the most posts will be published tomorrow! 👏🎁
-------------------------------------------------------------------------------
👇 👇 👇 👇 👇 👇
💸💸💸💸💸💸
👇 👇 👇 👇 👇 👇

STXUSDSTXUSD is at support. All confirmation has been given for an upward move. A buy trade is taken.

Stacks Attempting Falling Wedge Breakout on Higher TimeframesWe have the slightest bit of Bullish Divergence here on the RSI with Declining Volume to the Downside and are just about to test the Strength of this Wedge's Supply Line for the first time Since the start of the year. If we can break free from this Wedge we can very well see a Reciprocal ABCD move that would take us back to the 88.6% Retrace Above.


STXUSDPrice created an N wave formation above the alligator moving averages and 200 linear moving average. Tp is labeled by the Fib extension tool.

STXUSD First time above the 1D MA50 since April!Stacks (STCUSD) hit today and broke above its 1D MA50 (blue trend-line) for the first time since April 18 2022. The coin has been trading within a Channel Down pattern since the January 18 High. The long-term trend remains bearish as despite today's impressive 1D candle, the price remains both below the previous Resistance level and the Lower Highs trend-line (top) of the Channel Down.
Both in candles and in 1D MACD terms, today's formation resembles the 1D MA50 test of March 10. This candle not onl broke above the 1D MA50 but also marginally above its prior Resistance Zone and the 1D MA100 (green) and 1D MA200 (orange trend-line) periods (which at the time converged and transitioned into the bearish trend), but still got rejected at the top of the Channel Down.
As a result, we can only take a short-term buy here towards the Resistance and top of the Channel but not a long-term one. In order to buy comfortably on a medium-term horizon, the price needs to break and close above the 1D MA100 (green trend-line). In that case the target will be the 1D MA200.
--------------------------------------------------------------------------------------------------------
Please like, subscribe and share your ideas and charts with the community!
--------------------------------------------------------------------------------------------------------
STX based on the analysis STX is going to 0.78 but in my opinion as soon it breaks 0.97 level the correction is completed before hits the target.
peace:)


KC Strategy on weekly for STXWeekly uptrend, holding the 51 EMA on a higher low, potential hidden bullish divergence forming on RSI and Stochs, low Volatility. At an area where risk can be easily managed.

STXUSD Last dump before a multi-month rally.Stacks has been trading within a long-term Channel Up since the start of 2020 and is about to form a 1D MA50/ MA100 Bearish Cross. This is similar to the Bearish Cross of October 10 2020, which was the cross that paved the way for a 3 month rally. The 1D LMACD sequence between the two fractals is also identical. We should be expecting a bullish break-out by the first week of February.
--------------------------------------------------------------------------------------------------------
** Please support this idea with your likes and comments, it is the best way to keep it relevant and support me. **
--------------------------------------------------------------------------------------------------------

Stacks STX New ATH Breaking out! Stacks , STX built on Bitcoin Blockchain, miner of MiamiCoin MIA, and now NewYorkCityCoin NYCCoin ( be careful there is another New York Coin that is NOT this NYC...
Anyway... 2 different patterns , 2 different measured moves. Hit the small one first, then a small retrace, then hit the 1.618 FIB at $5.00 which is also a big psychological barrier too, ranked #51 room to grow

Stacks (STXUSD) to break some resistancesStacks (STXUSD) to break some resistances.
Those are at current price level for a new ATH.
But also in the OBV and later at the critical RSI-level.
But specifically the OBV is rising in a stable way.
And still some space until the above mentioned RSI "danger zone" 😎
Drop me a nice comment if you'd like me to analyze any other cryptocurrency or do another comparison.
*no financial advice
do your own research before investing

Stacks (STX) - November 25Hello?
Welcome, traders.
If you "follow", you can always get new information quickly.
Please also click "Like".
Have a nice day.
-------------------------------------
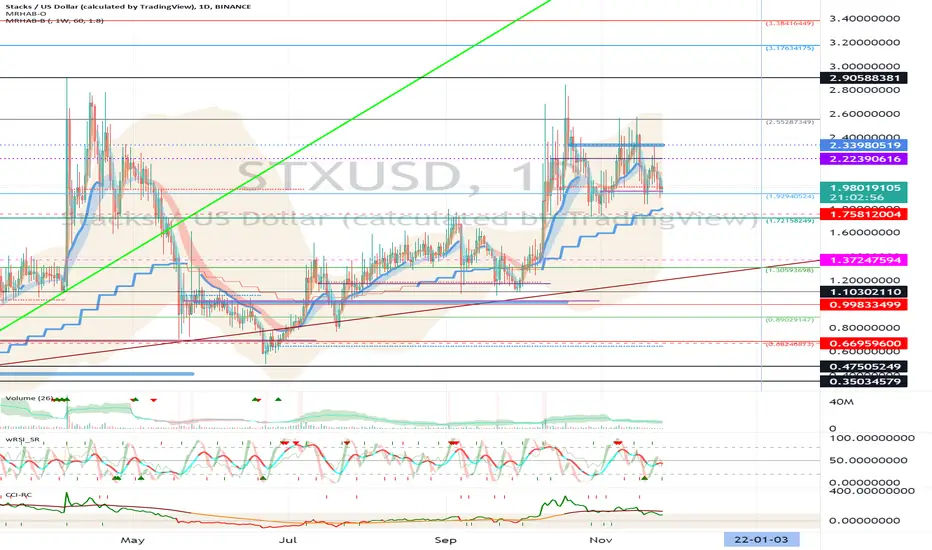
(STXUSD 1W Chart) - Mid-Long-Term Perspective
Above 0.35034579-0.47505249 section: expected to continue upward trend
0.99833499-1.10302110 or higher: Expected to create a new wave.
(1D chart)
First resistance section: near the 2.55287349 point
Second resistance section: 3.17634175-3.38416449
Support section: 1.72158249-1.92940524
If the price is maintained in the range of 1.92940524-2.55287349, it is expected to renew ATH.
It should rise above the 2.33980519-2.55287349 section to accelerate the uptrend.
If the price declines from the support zone, it may move towards the 1.10302110 point, so trade cautiously.
------------------------------------------
(STXBTC 1W chart)
Above the 2735 Satoshi point, we need to see if we can continue the uptrend along the uptrend line.
------------------------------------------
We recommend that you trade with your average unit price.
This is because, if the price is below your average unit price, whether it is in an uptrend or in a downtrend, there is a high possibility that you will not be able to get a big profit due to the psychological burden.
The center of all trading starts with the average unit price at which you start trading.
If you ignore this, you may be trading in the wrong direction.
Therefore, it is important to find a way to lower the average unit price and adjust the proportion of the investment, ultimately allowing the funds corresponding to the profits to regenerate themselves.
------------------------------------------------------------ -----------------------------------------------------
** All indicators are lagging indicators.
Therefore, it is important to be aware that the indicator moves accordingly as price and volume move.
However, for the sake of convenience, we are talking in reverse for the interpretation of the indicator.
** The MRHAB-O and MRHAB-B indicators used in the chart are indicators of our channel that have not yet been released.
(Since it was not disclosed, you can use this chart without any restrictions by sharing this chart and copying and pasting the indicators.)
** The wRSI_SR indicator is an indicator created by adding settings and options to the existing Stochastic RSI indicator.
Therefore, the interpretation is the same as the traditional Stochastic RSI indicator. (K, D line -> R, S line)
** The OBV indicator was re-created by applying the formula to the DepthHouse Trading indicator, an indicator disclosed by oh92. (Thanks for this.)
** Support or resistance is based on the closing price of the 1D chart.
** All descriptions are for reference only and do not guarantee a profit or loss in investment.
(Short-term Stop Loss can be said to be a point where profit and loss can be preserved or additional entry can be made through split trading. It is a short-term investment perspective.)
---------------------------------
Bullish momentum takes STX up to $2.20, gaining 7% moreStacks price analysis is bullish today.
Resistance is found at $2.29.
Strong support is present at $2.04.
The Stacks price analysis shows bullish momentum is taking the price higher every day. The recent bullish wave had brought brighter prospects for STX/USD as the crypto pair had gained significant value since 19th November, when the bulls took over the price function and started to elevate the price level by taking the bar higher every time.
Yet, there has been no considerable bearish hindrance seen as the bulls continue to rally high on a daily basis, however corrections have been observed on an hourly basis, but they have not impacted the daily uptrend. The next resistance for STX/USD is present at the $2.29 level. On the contrary, support for the coin is present at the $2.04 level, just above the psychological mark of $2.

STX: Conditions similar to the moment before the previous pumpTwo important indicators exhibit noticeable similarities to the point in time just before the previous pump got going:
1. Big market cipher wave beginning to flow upward.
2. ATR came down to basically the exact same value as it was before the pump.
Looking at the situation as a whole, I expect the price to travel down a bit further before then making a strong push back up again.

STX/USDTesting/tracking elliot wave theory. Please do not trade off idea without S/L. Not financial advice.

$STX cup and handle?Chart is self-explanatory.
After long consolidation, we formed the descending handle and at any moment we go to the target, which is also 1.618

STX 4 HOUR BULLISH BAT AND GARTLEY STX 4 hour bat backtest confirmed higher low manifests as a gartley pcz at end of falling wedge as well as at a critical inflection point going back to beginning of year (bold white line) , all time 78.6% retracement and local 38.2% retracement , rsi hidden bullish divergence , macd and cmf regular divergence
calling the bottom here on STX provided btc doesnt roll over

huge stx pump coming hidden bull divs , trend line supports, multiple bullish harmonics + successful backtests, stx to continue to outperform btc at a time when many alts are weak, higher highs higher lows, stx is layer 2 bitcoin , gains will compound as btc increases

STX about to pump hardSTX showing strong reaction to bullish bat on 1 hour STX/BTC on 4 hour bullish gartley . negative momentum weak, all emas reclaimed

