STX/USDT Weekly Outlook Golden Accumulation Zone
📌 Overview:
STX (Stacks) is currently retesting a crucial demand zone in the $0.63 – $0.72 range — the same area that previously served as the launchpad for a massive rally toward the $3.80 highs. This chart highlights a strategic opportunity for swing traders and long-term investors who understan

STX/USDT - 30-Minute Chart: Bearish Divergence Short SetupAnalysis & Rationale:
A high-probability short opportunity is forming on the STX/USDT 30-minute chart, primarily driven by a clear Bearish Divergence signal. While the price has registered a Higher High (HH), the Relative Strength Index (RSI) has failed to confirm this momentum, printing a Lower Hig

Technical Analysis of an STX/USDT Short Trade Setup in a DescendPlease provide a detailed technical analysis of the short trade setup illustrated in the attached image for STX/USDT on the 30-minute chart.
Your analysis should break down the following key components of the setup:
Market Structure and Pattern: Describe the dominant chart pattern, which is a descen

Stacks Short- Mid- & Long-Term Bullish Signals (PP: 900%+)Stacks is a very interesting project and I believe it has many fans. Here the signals are really good and by good I mean strong.
This pair, STXUSDT, has been a top performer but the action bearish since March 2024.
Between March 2024 and April 2025 we have a classic ABC correction, a long-term on

STXUSDT 1W Analysis STX ~ 1W Analysis
#STX Buy back gradually from here with a short-term target of at least 20%++.

STXUSDT LONGPrice has broken out of a consolidation range and retested previous structure support at 0.6299. Bullish momentum followed with a clean engulfing candle on the 1H timeframe, confirming potential continuation.
Entry: $0.6299 (demand zone retest)
Stop Loss: $0.6186 (below demand)
Target: $0.6900 zone

Potential 40x, if...if it reaches to my accumulation level, I believe STX has a 40x potential.
from $0.225 all the way to $9.25
The risk is yours to take.
Do not invest more than you can afford to lose.

SPOT STX LONG 12.06.2025Pinning after abnormal activity.
💰I enter at the market price.
I'll let you know when I record it manually.
‼️Risk per trade: 2% of the allocated funds for spot trading.
Thank you!

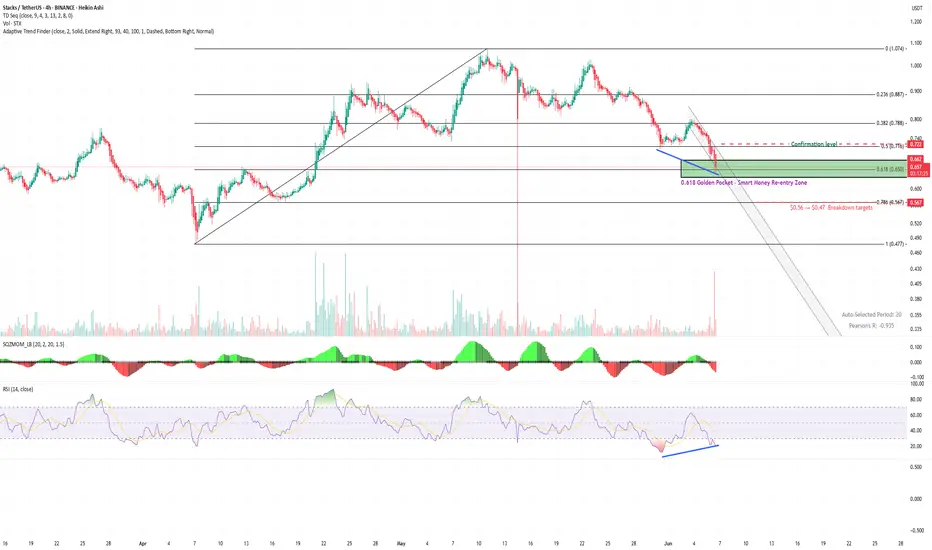
$STX / USDT (4H) – Golden pocket re-entryCOINBASE:STXUSD is testing the 0.618 Fib retracement ($0.65)
A zone where smart money often re-enters after corrections.
Confluence:
🔹 TD9 buy
🔹 RSI divergence
🔹 Fading momentum
🔹 Volume pickup near support = early demand?
Reclaim $0.72 could trigger a relief rally to $0.78–$0.80
Break $0.65 open
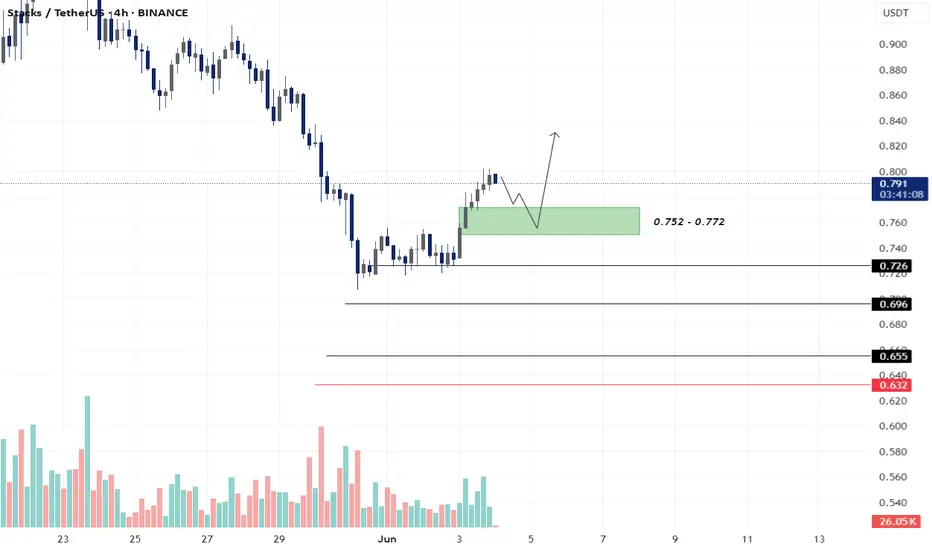
STX - LONG SET-UPBINANCE:STXUSDT
Green Zone (Demand Zone): 0.752 – 0.772
This is a bullish demand zone or entry zone where buyers previously stepped in.
Price may retest this zone before moving higher (as shown by the curved arrow).
Ideal area to deploy entries (25–50%) for a long position.
Acts as a support z
See all ideas
Summarizing what the indicators are suggesting.
Oscillators
Neutral
SellBuy
Strong sellStrong buy
Strong sellSellNeutralBuyStrong buy
Oscillators
Neutral
SellBuy
Strong sellStrong buy
Strong sellSellNeutralBuyStrong buy
Summary
Neutral
SellBuy
Strong sellStrong buy
Strong sellSellNeutralBuyStrong buy
Summary
Neutral
SellBuy
Strong sellStrong buy
Strong sellSellNeutralBuyStrong buy
Summary
Neutral
SellBuy
Strong sellStrong buy
Strong sellSellNeutralBuyStrong buy
Moving Averages
Neutral
SellBuy
Strong sellStrong buy
Strong sellSellNeutralBuyStrong buy
Moving Averages
Neutral
SellBuy
Strong sellStrong buy
Strong sellSellNeutralBuyStrong buy
Displays a symbol's price movements over previous years to identify recurring trends.
Curated watchlists where STXUSDT.P is featured.

Smart contracts: Make the smart decision
36 No. of Symbols
See all sparks