Stx Breaking Falling Wedge Stxusdt
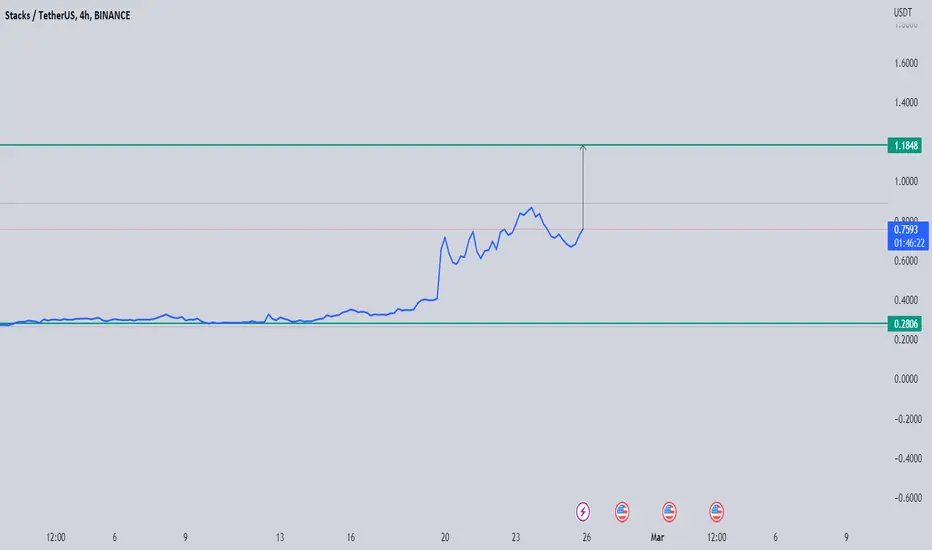
Based on my analysis of the Stx chart in the 4-hour timeframe, I have identified a bullish chart pattern known as a "Falling Wedge". This pattern is characterized by a series of lower highs and lower lows that converge into a point, forming a wedge-like shape that slopes downwards. The pattern is usually followed by a breakout to the upside, which could potentially lead to a significant price move.
Currently, Stx is trading within the Falling Wedge pattern, and it appears to be approaching a key resistance level that could trigger a bullish breakout. If the price manages to break above this resistance level and close above it, it would be a strong indication that the bulls have taken control of the market.
Assuming that the breakout is successful, I would expect the price of Stx to move towards the HKEX:1 level, which is a significant psychological resistance level. This level has not been tested since 2018, and if the price manages to break above it, it could trigger a new wave of buying that could potentially push the price even higher.
However, it's important to note that trading is always subject to market volatility and unexpected price movements, so there is always a risk involved in any trade. Therefore, it's crucial to set stop-loss orders to minimize potential losses and to have a solid risk management strategy in place. Additionally, it's essential to keep an eye on any news or events that could affect the price of Stx, such as new partnerships or regulatory changes.
STXUSDT trade ideas

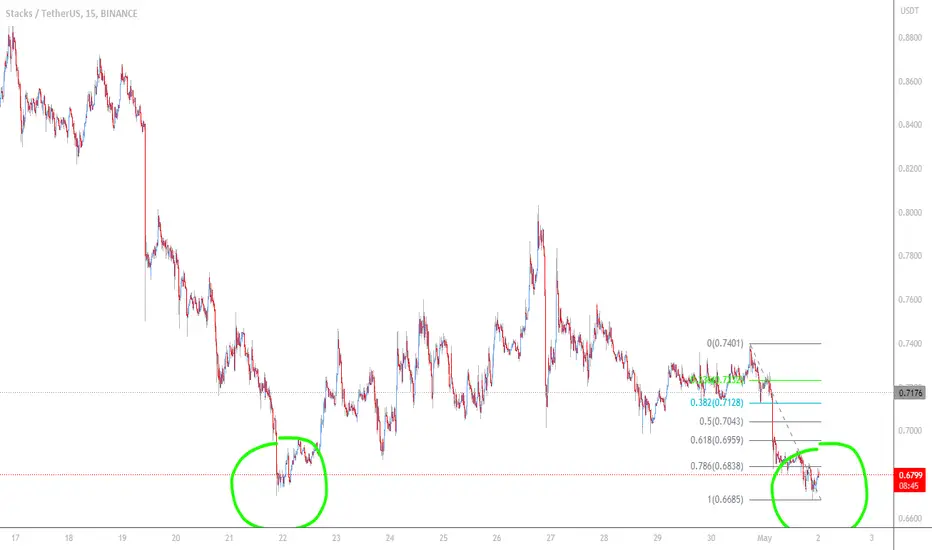
STX 4H BUYSTX 4H support is now at $0.72
Enter 50% at the current price
and try to set some BUY orders near the support zone
If STX stays above the trendline,
the Take-Profit target would be 5%, 10%, and 15% from your entry
Cheers

#STXUSDT | Long | Trade Set-Up#STXUSDT | Long | Trade Set-Up
Entry Conditions
| 20 DEMA Breakout
| Long term Trendline Breakout
| Flipped Weekly Pivot
| Bullish Signal
| CVD Trendline & Resistance Breakout

STX Long & Short Ideaeverything is explained on the chart, comment if you doubt anything.
STX will fly once it breaks out the trendline. however, be aware of losing the ascending bottoms..
you can flip short as we are heading to the week if ONLY it breaks down the SL mentioned on the chart.
feel free to share your thoughts!
GL ALL.

STX/USDT end of retracementTime to get back into STX. The very clear double bottom serves as confirmation of the trend reversal.
I'd expect it to move up rapidly from here, so unless and until there's any suggestion otherwise, knock yourself out.
STXUSDT Falling WedgeSTXUSDT is trying to breakout bullish from the falling wedge pattern and on break of Neckline will reverse the current bearish trend.

STX : INCREASE VIEWSTX is in an uptrend at this moment on the last volume counting range.
We will follow STX coming time to see if it's able to gain
Falling wedge Price making a falling wedge and breaking out of the trendline before the fed decision on Wednesday.... if it's positive for BTC the it's positive for STACK, the buy will continue. But we will have to wait for a retest to go long for some of us who are late.

Stx Breaking Falling Wedge Seems like Ready another Bullish Move Breaking Falling wedge In H8 timeframe incase OF successful breakout expecting Move Towards 1.30$

Long STX Decending wedge formed, with double bottom in place. Good point for entry, wait for break of triangle with volume before entry

STXUSDT Long 0.7363Long idea based on chart pattern. Stop Loss and Target are based on support/resistance.

STX Scalping Trade Stx bounces form the bottom of the Downward Channel and We Have a Good Chance for long from here

STXUSDT HIT HIS FIRST TAKE PROFIT "Based on my analysis, I believe STAX (STX) has strong potential for SHORT term growth. I recommend considering SHORT position with a buy entry point at . My target for taking profits is at . Please note that investing in cryptocurrency involves risks and it's important to do your own research and make informed decisions. #Ethereum #Crypto #Investment"
Remember to always provide a disclaimer that investing in cryptocurrency carries risks, and it's crucial for individuals to conduct their own research and make informed decisions based on their own risk tolerance and financial situation. Additionally, please make sure to comply with any applicable laws and regulations related to financial advice or investment recommendations in your region.

$STX: Anticipated Breakout; Divergence Signals, and Fib zones
On the daily, the RSI is within a symmetrical triangle, indicating an anticipated breakout by May 11.
It would be ideal if STX closes the daily candle above $0.82 today, as it aligns with my previous Fibonacci expectations, as indicated on my TradingView chart (link: ).
My divergence indicator shows a divergence based on the commodity channel index and identified support zones.
Being transparent, I cannot provide a clear guideline at the moment. While I lean towards quick upward price movement, there are multiple factors at play, and a broader perspective is needed. It all depends on the king (referring to Bitcoin), which is currently experiencing resistance at 30.4k and has corrected to the baseline of the Bollinger Bands. If it can establish a baseline there and continue its upward momentum to FWB:36K , we might see a bottom forming soon and some quick price developments.


STX- Stacks Possible position trade Good day, fellow traders
As you can see STX is in a nice position for a possible reversal and further upward movement. The position is favorable, with better management of risk reward.
A wave 5 is surely on the cards.
As always trade safe and nobody can see the order book.
P.S BTC movement will help or stall
Good luck and have Fun

stxusdtFor spot buying in two areas, with the specified loss limit. If you made the purchase in the first area, and you wanted to average, the second area and the second loss limit will be activated.

STXUSDT Mid-Term Short PlanOKX:STXUSDT
Today, CPI data will be released.
It is very important for all markets as well in Crypto.
After CPI data, I believe that it will start a sell pressure in all markets and If we support this idea with technical analysis we can do something like in the chart.
STX is on a good level with supported technical setups like Libra + Cypher + Elliot.
The main target is far away but it is not impossible because when you look the chart zoom out you will see that STX had a solid rally in near future and needs correction...
Therefore, the main target will be the bigger harmonic pattern D point as pointed on the chart.
May the force be with you.
Good Luck!

Stx | Breaking Out Falling Wedge Stxusdt
Breaking Out Falling Wedge Pattern in 4H Timeframe
In the event of a successful breakout and retest, we anticipate a 30-50% bullish move.Once confirmed, we will wait for a retest of the breakout level to establish support before entering a long position. Our target for this trade will be set at a 30-50% move to the upside. Risk management measures will be put in place to mitigate any potential losses.
Please keep in mind that our ideas are based on our experience and knowledge, and may not be completely accurate as the market is always unpredictable and anything can happen at any time. It is essential to conduct your own research and use your own knowledge when trading. If you are happy with our work, join us

STX price action finding support on the 4hr 200maSTX posted 4-9-23 +14% gains ... so far
here is another entry idea ( if you missed it ) or to add to entry ( scaling into the trade )
on 4-9-23 hidden bearish div played out and support bounce off of yellow dotted line played out
wait for break of 1.0156 with volume confirmation for entry / or retest of 1.0156
price action finding support on the 4hr 200ma
if price action ( PA ) pulls back and bounces of blue trendline , this would be a nice entry
Market Cap: 1.3B
Category: DeFi / Metaverse
Target 1: 1.2223
Target 2: 1.3965
Target 3: 1.5420
Stop Loss: 0.8475
Manage Risk - have a stop loss in place
Not Financial Advice
This is for Entertainment Only

STACKS - Unstoppable One of my favorites and a reliable choice for a very good 3 successful trades.
If you are not aware of what STACKS is you should def look into it as it has immense potential going forward.
STX is a Bitcoin layer for smart contracts
What Is Stacks (STX)?
Stacks is a Bitcoin Layer for smart contracts; it enables smart contracts and decentralized applications to use Bitcoin as an asset and settle transactions on the Bitcoin blockchain.
Bitcoin is the largest, most valuable, and most durable decentralized asset. The Stacks layer unlocks $500B in BTC capital using the Bitcoin L1 as settlement for decentralized applications.
Stacks has knowledge of the full Bitcoin state, thanks to its Proof of Transfer consensus and Clarity language, enabling it to read from Bitcoin at any time.
All transactions on the Stacks layer are automatically hashed and settled on the Bitcoin L1. Stacks blocks are secured by 100% Bitcoin hashpower. In order to re-order Stacks blocks/transactions, an attacker would have to reorg Bitcoin.
My spot holding have grown from 20 cents to almost x5 and the leveraged trades went even better...
Only Bullish on this one as i see 10-18 range for the next 2 years.
One Love,
The FXPROFESSOR

Stxusdt Stacks
Liquid staking derivatives so hot right now
Coming up against weekly sma
After that not much resistance till aths tbh
Might see a narrative wave across all lsds
Lido stacks frax rocket pool etc

