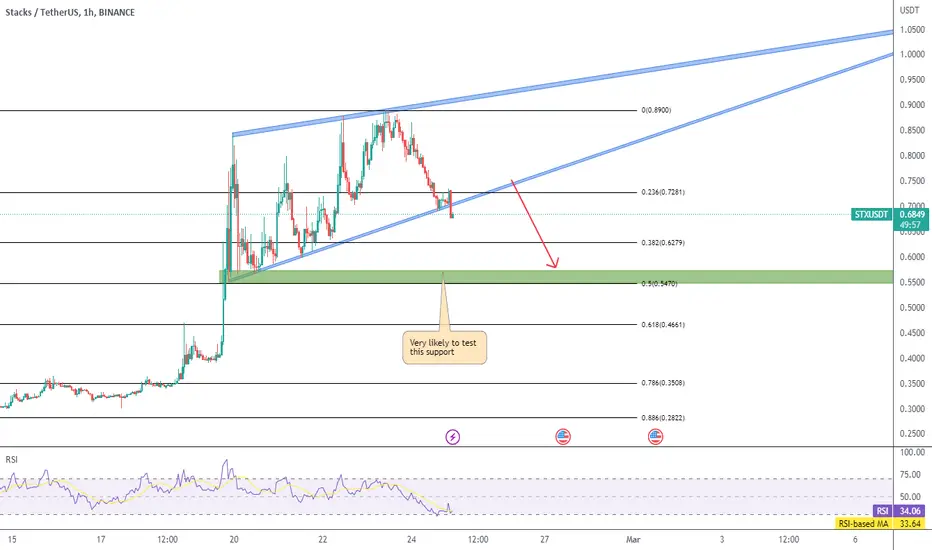
STX: Approaching SupportTrade setup : After sizeable gains (~400% YTD 2023), price was met with selling pressure around $1.05 resistance area. Now we wait for price to find support level and for momentum to inflect bullish again (MACD Histogram rising). Fibonacci retracement levels (potential support) are $0.73 (38.2%), $0.63 (50%), and $0.63 (78.6%).
Trend : Neutral on Short-Term basis and Uptrend on Medium- and Long-Term basis.
Momentum is Mixed as MACD Line is below MACD Signal Line (Bearish) but RSI > 55 (Bullish).
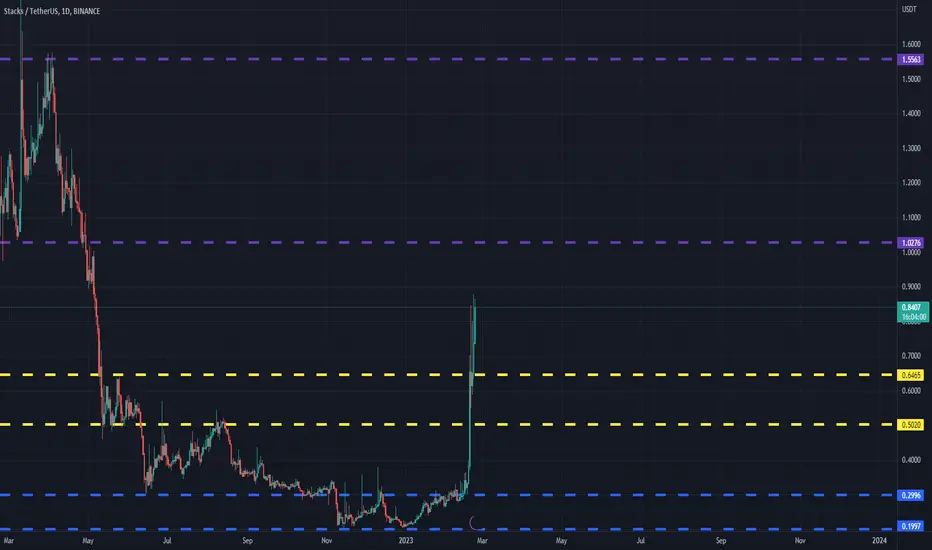
Support and Resistance : Nearest Support Zone is $0.80, which it broke, then $0.60, and $0.40. The nearest Resistance Zone is $1.05.
STXUSDT trade ideas

STX LONG SCALPAO is making higher highs w/ a divergence
Same thing in the Cipher
Small risk, Big reward
not financial advice.

STX 8X POTENTIAL LONG SCALP - 30MIN
CIPHER makes a higher high
AO in the green
1% risk, 8% gain potential

✴️ This Isn't Over... 425% Is Just The Beginning!Let's go back to Stacks because I already showed you literally hundreds of different charts and there is no point in looking for new ones, more opportunities available than the ones that we can take.
This will give further strength to our bullish position.
First, notice the ultra-high volume.
This tells us that things are only getting started.
The RSI goes super high just as it happened in August 2020.
The MACD enters the bullish moving north for the first time ever.
We have a long-term higher low.
A higher high is possible next.
Above $4 is the potential... More or less!
Projection for new All-Time Highs in 2024 for the Altcoins or 2025.
And 2025 for Bitcoin.
We are still early even after 425% of growth.
People will be joining months for now, years from now...
By the time retail buying, traders will be selling.
That's the great advantage of reading this, of being here, now!
Namaste.


$STX - Bullish Pennant Breakout Entry$STX is in news after publication by LunarCrush. On Daily and Weekly it's showing a heavily bullish sign, this is 4h timeframe and it did a breakout from pennant which is ascending means forming HL but also LH.
I have kept two targets, first target is a resistance on Daily and second target is a Weekly resistance.
You can either enter if price comes back for a retest at breakout level or you can take entry at any level in between, but I technically believe that bullish momentum is strong and price might not come back for a retest.
Plan your trade and DYOR.

$STXUSDT PAIR, DEMAND ZONE BREAK DOWN, POTENTIAL SHORTING 10%SHORT AT LEAST 7-10% , broke down support with high volume, set cut loss above demand zone.

$STXUSDT, Ascending Triangle, bullish continuation patternAscending Triangle Break Out from pattern, expecting at least 15% gain.

STXIdea: The price is trying to break through a strong resistance level. The price is in the zone of the strongest overbought RSI on almost all timeframes. The price will fall to the nearest support of $0.5 in case of a correction. be careful


STX - Breaking down from wedgeSTX is breaking out to the downside from the rising wedge, which gives us a high probability that 0.55 support will be tested.
Note that we are also oversold on the H1 timeframe, so we could see some sideways consolidation before stronger moves down.
Cup and Handle on 15 and 30 minutes time frame of $STXBINANCE:STXUSDT Continuation up trend pattern, waiting for breaking out to confirm the continuation, can expect price up to or at least 0.87 to 0.99

STX/USDT headed to $1.00+ STX/USDT is headed to a psychological $1 (I think).
Note the Purple Candles by Sam indicator (purple candles). The indicator is here on TradingView.
Have a trailing take profit just before $1 - as it might run past that.
Squeeze indicator looking strong and DI/ADX is turning up.

STX LONG & HOLDSTX insight.
Stacks has shown a formidable growth in the last few weeks and the best approach at the moment would be to buy some of this coin at the pullback to the highlighted zone.
The possible targets of this move are highlighted by lines for you.
Just hold and rebuy.

STXUSDT(Stacks) Daily tf Range Updated till 23-02-23STXUSDT(Stacks) Daily timeframe range. from its local low it retraced back to 320%+ thats actually quite insane. it needs little bit more volume to push toward 1.0276#. after that it got midrange which is 1.300#.but that depends how retail interest keeps up.
STXUSDT CHART- 23/2/23 WHERE TO TAKE PROFITWhere to enter and exit on stx trade
enter 0.835
stop loss 0.74
take profit 1.12

STX is at resistance again.Blockstack PBC, a software business that seeks to establish a decentralized internet, developed the cryptocurrency STX. The native coin of the Blockstack network, which employs a particular blockchain created to support safe, decentralized apps, is called STX.
The Blockstack ecosystem, which includes the Stacks blockchain and the decentralized apps developed on top of it, is powered by STX. STX is a key component of Blockstack's vision of a user-centric internet where people control their data and identities.
Within the Blockstack ecosystem, STX may be utilized for several things, including:
Using the Stacks blockchain and paying transaction costs
Participating in the Blockstack consensus method through stake
By rewarding users for contributing to the network and participating in governance procedures, the network can encourage developers to create new decentralized apps.
There are two support levels on the way down, and two resistance zones on the way up. One of the resistance levels is very strong and can push the price down for now.
Let me know if you guys have any questions;
I will be more than happy to help.
Good luck, and thank you.

STX looks bullishSTX looks to head higher as there was a lot of volume recently and the demand zones seems to hold and we can expect a reversal upwards.

20th Feb 2023 - Trade idea #4Daily trading ideas especially for altcoins. You can use your own trading analysis/strategy to see if one of the daily ideas suits you.

STX - weekly charthi.... Now trying to break the downtrend. Worth following. The weekly closing above the trend after the breakout makes it a good opportunity to enter.

Stx Trying Clear Another Resistance Stx Looking Good For Midterm & formed Descending Channel In daily Timeframe
Incase Of breakout Expecting 110 To 130% bulish Move Keep Your On stx for breakout

STXUSDT is preparing for an impulsive wave 3 It appears that STXUSDT is preparing for an impulsive wave 3. Support has been found at the 0.618 Fibonacci level, and by using Fibonacci extension, the following resistance points have been identified. Although it's just a possibility at this point, $STXUSDT could be quite intriguing.

