🆓Stacks (STX) Mar-17 #STX $STX
After being rejected at 1.8$, STX fell sharply to 1.2$ to retest this zone. The selling has decreased a lot when approaching this $1.2 zone so in the next few days we could see a rally at least to the $1.4 and $ 1.6 zones. STX can also increase sharply to retest the 1.8$ zone but to overcome this zone will be very difficult with the current trend.
📈RED PLAN
♻️Condition : If 1-Day closes ABOVE 1.2$ zone
🔴Buy : 1.2
🔴Sell : 1.4 - 1.6 - 1.8
📉BLUE PLAN
♻️Condition : If 1-Day closes BELOW 1.2$ zone
🔵Sell : 1.2
🔵Buy : 1.05 - 0.9
❓Details
🚫Stoploss for Long : 10%
🚫Stoploss for Short : 5%
📈Red Arrow : Main Direction as RED PLAN
📉Blue Arrow : Back-Up Direction as BLUE PLAN
🟩Green zone : Support zone as BUY section
🟥Red zone : Resistance zone as SELL section
STXUSDT trade ideas

💡Don't miss the great buy opportunity in STXUSD @StacksTrading suggestion:
". There is a possibility of temporary retracement to the suggested support line (1.295).
. if so, traders can set orders based on Price Action and expect to reach short-term targets."
Technical analysis:
. STXUSD is in a range bound, and the beginning of an uptrend is expected.
. The price is above the 21-Day WEMA, which acts as a dynamic support.
. The RSI is at 75.
Take Profits:
TP1= @ 1.595
TP2= @ 1.769
TP3= @ 1.988
TP4= @ 2.195
TP5= @ 2.465
SL= Break below S2
❤️ If you find this helpful and want more FREE forecasts in TradingView
. . . . . Please show your support back,
. . . . . . . . Hit the 👍 LIKE button,
. . . . . . . . . . Drop some feedback below in the comment!
❤️ Your support is very much 🙏 appreciated!❤️
💎 Want us to help you become a better Forex / Crypto trader?
Now, It's your turn!
Be sure to leave a comment; let us know how you see this opportunity and forecast.
Trade well, ❤️
ForecastCity English Support Team ❤️

💡Don't miss the great buy opportunity in STXUSD @StacksTrading suggestion:
". There is a possibility of temporary retracement to the suggested support line (1.295).
. if so, traders can set orders based on Price Action and expect to reach short-term targets."
Technical analysis:
. STXUSD is in a range bound, and the beginning of an uptrend is expected.
. The price is above the 21-Day WEMA, which acts as a dynamic support.
. The RSI is at 74.
Take Profits:
TP1= @ 1.595
TP2= @ 1.769
TP3= @ 1.988
TP4= @ 2.195
TP5= @ 2.465
SL= Break below S2
❤️ If you find this helpful and want more FREE forecasts in TradingView
. . . . . Please show your support back,
. . . . . . . . Hit the 👍 LIKE button,
. . . . . . . . . . Drop some feedback below in the comment!
❤️ Your support is very much 🙏 appreciated! ❤️
💎 Want us to help you become a better Forex / Crypto trader ?
Now, It's your turn !
Be sure to leave a comment; let us know how you see this opportunity and forecast.
Trade well, ❤️
ForecastCity English Support Team ❤️

STXUSDT Reversal after sudden fallSTXUSDT Reversal after a short sudden fall as bullish one white soldier is setup?
Note: This is not reflecting BTC price which is sidelined in last few hours

Strong resistance danger: SHORTITS UNDER RESISTENS AND NEED TO REST FOR A TIME .
Strong resistance
-----------------------------------------------------*********************

STX BOUNCE OR MORE CORRECTION?STX is a good project. You can earn BTC by staking your STX coins.
STX is standing on the red trendline. If this trendline going to be broken, I guess it can fall back to 0.5$. In my opinion, this area is a strong buy area.
In case of bounce, if it can menage to go above 2.8$ next target will be the upper trendline.
This is my trial. Not a financial advice.

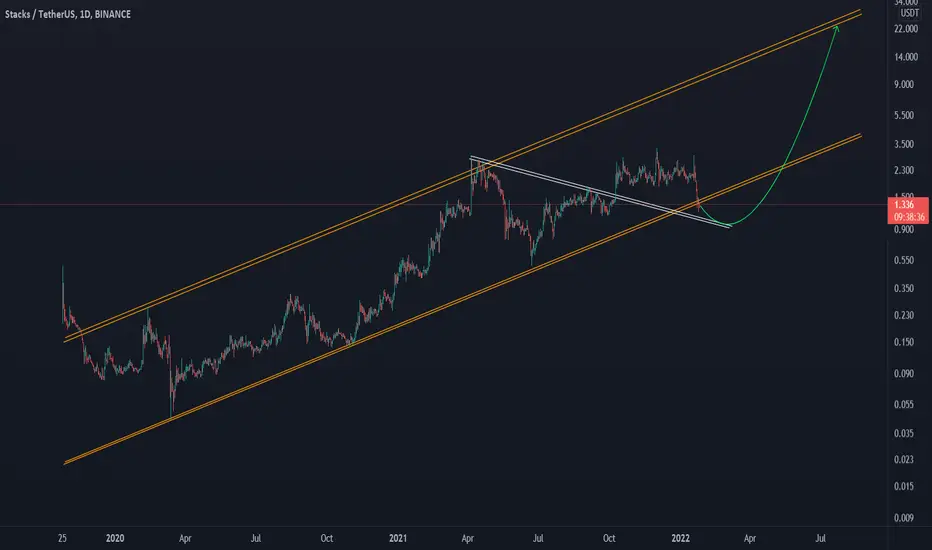
STXAt the bottom of the uptrend channel, the downtrend line has broken and is pulling back to it.
It can grow to the top of the canal after completing the pullback.
Bag🎒 your STACKS once again! Stacks broke up this triangle 📐 and I think there is chance for run to 3.55 and even higher. Setting BUY LIMIT order to catch the pullback. STX just pamp eet! ⛽
ENTRY : local high @ 2.19
STOPLOSS (SL) : local low @ 1.94
TARGETS (TP) : TP1 - resistance @ 2.70 | TP2 - resistance @ 3.09 | TP3 - height of the triangle projected from midpoint of the local range (BUY LIMIT - SL) @ 3.55
REWARD RISK RATIO (RRR) : TARGET1 - 2.0 | TARGET2 - 3.6 | TARGET3 - 5.5
INVALIDATION : when SL level hit
My previous STX ideas 👇
Check my other stuff in related ideas.
Please like👍, comment🗣️, follow me✒️, enjoy📺!
⚠️Disclaimer: I'm not financial advisor. This is not a financial advice. Do your own due dilingence.


STXThis currency can grow well according to the news tomorrow
Ichimoku's strong resistance is in front of his way, which I think can break and grow very well.

patternSTX
The price is currently accumulating at the flag’s ceiling in preparation for a possible breach. If the breach succeeds, God willing, it will head towards 55% profit, God willing.. If the breach fails, it will return towards $2.34
Negative below $1.96
Long-distance goals up to $6.66 with a 240% profit rate

StxTamami navahie hemayati v moghavemati nazdk taeen shode,bar asas tahlil khodetun,ravand bazar,mizan hajm v shekast moghavemat ya pasokh b hemayat mitunid dar time ruzane kharid dashte bashid

STX / USDT 1 hour (Fast edit)STX, potential bounce in the chart, falling wedge, volume running out and Binance support Network Udpate. Let's see if binance gives us scam pomp. Hope BTC is relaxed next hours.

STXUSDT AnalysisHello friends.
Please support my work by clicking the LIKE button(If you liked).Thank you!
Everything on the chart.
open pos: market and lower
target: 2.8 - 3.2 - 3.6
after first target reached move ur stop to breakeven
stop: under 1.5 (depending of ur risk). ALWAYS follow ur RM .
risk/reward 1 to 3
risk is justified
Good luck everyone!
Follow me on TRADINGView, if you don't want to miss my next analysis or signals.
It's not financial advice.
Dont Forget, always make your own research before to trade my ideas!
Open to your questions or suggestions.

$STX Lot of event on Desember. don't miss it !$STX Lot of event on Desember. don't miss it !
ljfnwjbefnwnefowneovnwovnwojnvwovnweonvoewnvweovnoewvnoewnvweovwonv

STXUSDTHello
STX is moving in an channel.Due to its strong foundation, it can be suitable for entering according to this set-up.
....observe capital management....
Fayyaz Salehnezhad

STX long$STX is showith strong bullish momentum. Correction after an explosive clear move stopped around Fibonacci 0.5 level which is also the support level from previous high. Bullish movement to fibonacci 1.2 Level is expected to happen.


$STX /USD, ATH and instant 20% $STX /USD
ATH and fast 20% on a new 2D Buy signal by UCTS
(I will take it😄)
Let see if it can hodl/flip this area and look for continuation after such breakout
#STX

stx/usdt analysishello my friends
this my idea about stx all things are clear on the chart
thank you

STXUSDT trade I the best trading pointSTXUSDT trade in the best situation where it can boost up 3X. Trade will be between 78% fib level and 261% fib level. We will update further about analysis if we find any change in idea. Stay tune.
