STXUSDTThe rising swing trade volumes indicate heightened market activity, while algorithmic analysis signals the potential onset of a bearish trend. This is a short-term swing.
STXUSDT trade ideas

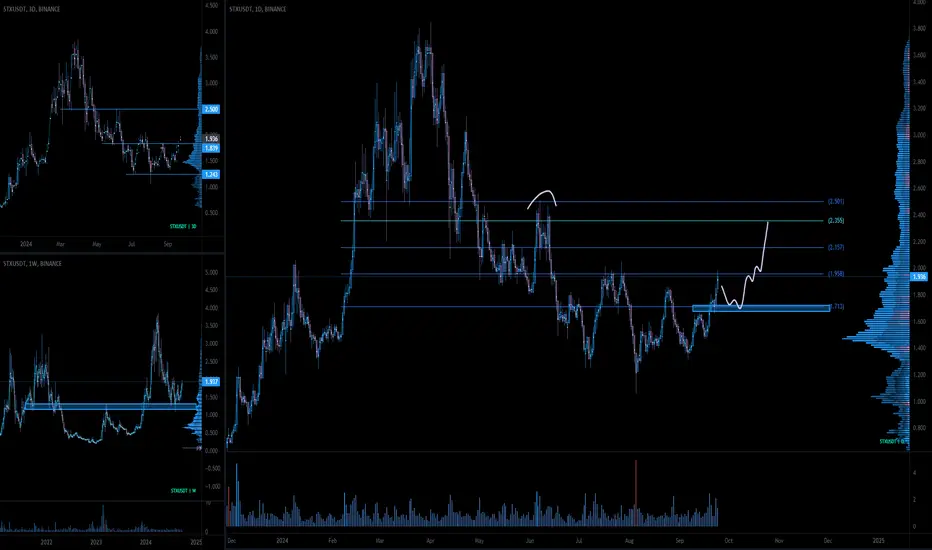
October Picks: Stacks (STX) Gearing Up for new ATHs
📈🔥 October Picks: Stacks (STX) Gearing Up! 💥📊
Kicking off October with a promising setup! Historically a strong month for crypto, and Stacks (STX) is already up by 4% today. The chart reveals an ascending channel, with a rejection at 1.943.
Key Levels to Watch:
Support: 1.789 and 1.735
Breakout Zone: 1.95
Next Target: 2.76 🚀
This month, I’ll be sharing some of my favorite chart setups early on, so stay tuned for more picks coming soon! For more insights on STX, check out my previous analysis .
One Love,
The FXPROFESSOR 💙
Big chart and targets here:

STXUSDT BUY OPPORTUNITYSTXUSDT has formed a giant bullish pole and flag pattern. Within this larger structure, we've identified an internal bullish continuation pattern, also a pole and flag, which has achieved its projected target. We have outlined a strategic buyback area, named the accumulation zone, which should act as a strong demand area for the coin. This setup requires maximum patience, but it promises significant rewards as indicated on the charts.

STXUSDT 1DWait until the price crosses the resistance and you can enter the long trade in the price retest! In the second scenario, there is a possibility that the price will once again return to the bottom of its ascending channel, which is the best place to trade long.

$STX Key levels to watchSTX (Stacks) is breaking out of a 3-month consolidation and is now nearing its horizontal and psychological resistance at $2
A bullish structure is forming, and we have significant upside potential if we can break through the immediate resistance, which has now been tested for the third time.
There's strong support between $1.70 and $1.65. In my view, any dip to this range is a buying opportunity. If this level holds, we could see a move up towards $2.3 to $2.5
Buy Trade Idea for STX (Stacks)Description
Stacks (STX) is a unique cryptocurrency that brings smart contracts and decentralized applications (dApps) to Bitcoin, unlocking new opportunities within the Bitcoin ecosystem. Here are the key fundamentals supporting a potential buy trade for STX:
- **Bitcoin-Powered Smart Contracts:** STX is the first cryptocurrency to enable smart contracts on the Bitcoin blockchain, combining the security and stability of Bitcoin with the versatility of programmable contracts.
- **Growing Ecosystem:** The Stacks network is rapidly expanding, with a variety of decentralized applications being built, especially in areas such as decentralized finance (DeFi) and non-fungible tokens (NFTs).
- **Clarity Language:** Stacks uses the Clarity programming language, designed to be predictable and secure, reducing bugs and vulnerabilities in smart contracts, which is key for long-term growth and adoption.
- **Secure and Transparent:** STX leverages Bitcoin’s proof-of-work security model to anchor its transactions, ensuring high security and transparency for users and developers alike.
Given these strong fundamentals, STX presents an attractive buy opportunity for investors looking to capitalize on the integration of smart contracts and Bitcoin’s robust security framework.
Disclaimer
Trading and investing in cryptocurrencies involves significant risk and can lead to substantial losses. The information provided is for informational purposes only and should not be considered financial advice. Cryptocurrencies are highly volatile, and prices can fluctuate due to various market factors. It is important to conduct your own research, assess your risk tolerance, and consult with a financial advisor before making any investment decisions. Past performance does not guarantee future results.

STX - USDTThe STX/USDT chart shows the price testing a crucial resistance zone (Blue). A successful breakout above the resistance zone (Blue) could trigger a strong bullish wave. Failure to break this level may lead to further consolidation or downward movement.

Head & Shoulders pattern: C-waveChart description
Skewed H&S pattern. Looks confirmed;
Price broke previous local high;
Additional confirmation 50/100 sma cross;
Expecting this to be a C-wave (3rd wave);
Intermediate price targets laid out in chart

STX/USDT100 percent growth within a month or two seems possible. Keeping an eye. Looks boullish over EMA 100.
What do you guys think!??

STXUSDT Triangle BreakoutSTXUSDT technical analysis update
STX is breaking the symmetrical triangle resistance with high volume, and the price is trading above the 100 EMA on the daily chart. This is considered a strong bullish signal for STX.
Buy zone: Below $1.75
Stop loss: $1.55
Regards
Hexa

Stacks – Primed for a Breakout with Strong Bitcoin IntegrationAbout Stacks (STX): Stacks is a unique project that brings smart contracts and decentralized applications (dApps) to Bitcoin without altering Bitcoin’s core. It has a market cap of $2.52 billion and a 24-hour trading volume of $167 million, showing strong market interest.
Impact of Rate Cuts: With the Fed's recent 50 bps rate cut, risk-on assets like STX are expected to thrive as investors seek high-growth opportunities in the crypto space. Stacks, building on the strength of Bitcoin, stands to benefit from this macroeconomic backdrop.
Entry Point: STX is currently trading at $1.69, showing a 12.1% increase in the last 24 hours. Immediate support is at $1.17, and a breakout above $2.76 could set the stage for a strong bullish rally. The primary target is $4.33, while the maximal target in a moonshot scenario reaches $19.
📊 Technical Levels:
Support: $1.17
Primary Target: $4.33
Maximal Extension: $19 (Moonshot Scenario)
The chart is showing STX flirting with a breakout, and the combination of Bitcoin’s stability and smart contract capability could push STX higher.
If you like STX, perhaps it’s time to diversify with AI + Crypto unicorns like CRGPT 🤖🚀.
One Love,
The FXPROFESSOR 💙

$STX squeeze coming upWould like to see BTC hold above $59,500 and close out a daily candle in the green to trickle down the bullishness with correlated Stacks NASDAQ:STX , bullish wave back up a few Fib levels as the end of the current macro squeeze is coming up. Been steady sideways accumulating for the past 5 weeks. Bearish scenario it breaks the wedge and dips down to the Lower Support Zone.

STXUSDT touch confluence | Long BiasOn week chart
BINANCE:STXUSDT hit and bounce back from the ascending trend line and Golden Ratio on week chart
On 4H timeframe
BINANCE:STXUSDT had returned to fill orders and bounce back
With signals from week and 4h timeframes, my opinion likely Long bias for this time and wait confirmation to trade
Wait and see

STX ANALYSIS#STX Analysis 🚀🚀
As we can see that #STX is trading in a Descending Channel Pattern in daily time frame and also there is a breakout. After a small retest towards it's support zone we would see a reversal in #STX 💸 💯🚀
💸Current Price -- $1.785
📈Target Price -- $3.000
⁉️ What to do?
- We have marked crucial levels in the chart . We can trade according to the chart and make some profits. 🚀💸
#STX #Cryptocurrency #DYOR

POSSIBLE LONG ON STXusdtDaiy candle opened above 1.628 which is a good sign for LONG in my opinon.
Just a friendly idea of mine not a finacial advise.
My TP are on the chart
If we brake the bear flag then we could see a rise up to 2.461
My stop loss would be 1.561
Good luck everyone
Trade Safe

STX inside amazing logarithmic parallel channelThis graph portrays STX's *logarithmic* path in WEEKLY.
I've added its textbook Elliot Wave pattern to illustrate even more what it's apparently doing.
It fits amazingly well inside that parallel channel, with an pixel-perfect bounce at the end of wave 4.
Apparently, we have only to wait pattern continuation to uncharted new hights at the end of that wave 5.
What will the top number be? I dont know, I'll leave that to the experts. Maybe Fibbonacci will tell us?
Please, don not hesitate to share your thougts.
Peace

STXUSDT 2D#STX structure looks promising. It has formed a bullish flag on the 2-day chart and is pressing the MA200. It has the potential to reach a 400% target price in the mid-term.


STX USDTSTX is currently in a bearish trend and has been moving within a descending channel for approximately 157 days. The chart clearly shows the price making lower highs and lower lows, respecting the boundaries of this channel.
At the moment, the price is positioned near a critical juncture where it could potentially break out of this descending channel, signaling a reversal. For a bullish move to occur, STX must break above the channel’s upper boundary. This resistance has acted as a barrier to the price, preventing any significant upward movement.

Stacks Pre-2025 Bull-Market Accumulation Zone & StrategyFor Stacks, let's consider the action in early 2023 first.
There is always a consolidation period between major waves.
1) Bullish-wave.
2) Correction.
3) Accumulation (consolidation period).
Chart:
Now let's consider present day; 2024.
I am doing mainly two things here: (1) Showing you how the market works and (2) supporting my thesis regarding what will happen next in the crypto market.
Chart:
1) Strong bullish-wave.
2) Strong correction.
3) Accumulation phase (consolidation period before any new and strong bullish action).
Due to the strength of the previous bullish wave the accumulation phase can be longer for this pair. This is just a potential and doesn't necessarily need to happen but the dynamics are not the same here as for a pair which produced minor growth in late 2023/early 2024. This pair might not go to new highs or might outperform the entire market again. We don't know at this point in time how those that moved strongly last year will perform next year. See the XRP Pre-2025 trade for additional information on this point.
What we know for sure is that the market never moves in a straight line and is never in a hurry. And even with these uncertainties we can still define an accumulation zone, which is the most important part at this point in the market cycle.
What happens if the market runs and everything starts growing instantly 1,000,000% while we wait for the accumulation phase? Nothing. We let go of it and move smoothly to the next pair/chart, the one right next to it. If it runs faster than you can catch it, it means it was not meant for you. But it never means that you need to FOMO or hurry, but, opportunities are endless. In fact, there are so many good opportunities that it is impossible for you to take them all.
Let's go back to our usual schedule.
Let's remove all doubts and uncertainty.
The cryptocurrency market is booming. Bitcoin is growing.
Bitcoin and the cryptocurrency market continues to mature, it continues to evolve.
The amount of action, the number of participants, the amount of capital now available within the market is much bigger than in years past and it is only set to grow bigger and wider. It is set to get better as more and more countries open up to crypto and all the many benefits this incredible technology has to offer.
If Stacks did great last year, with less capital and attention, it can do even better in the future. We will go with the bullish bias. Crypto has been in a very strong growth trend every forever. There is absolutely no reason to assume it will be different this time around specially when the legislative and political situation around world is only improving for this sector of the financial industry. Do we agree on this point? Crypto-bullish!? Sure, or else you wouldn't be reading this.
Stack's new All-Time High potential in 2025/26 can reach as high as $10 based on current data and simple Fibonacci extension projections.
The key factor as to how inflation will affect our price projections can be completely ignored. All we need to do is buy low to sell high. Buy and hold focusing on the long-term. Tracking such details can become a waste of time and energy. Imagine, just 100% profits is great if you compare it to any other type of venture, anywhere period. Which means that 200% is even better and 300% is absolutely insane. When we aim for winnings such as 10X and higher, we don't need to worry about petty details and that's the purpose of the long-term strategy, i.e., peace of mind.
A short-term trader needs to consider such nuances as fees, commissions, slippage and what not, because they are focusing on a 1% move. When you look at the bigger picture, you only have to focus on your life and instead of having to follow the market you let the market take care of you.
There are many ways to approach the financial markets. And each and every successful trader uses a different method. So do what works for you. There are not two highly successful traders that do exactly the same, everybody has their own way and that's the way it is.
Stacks has been going down for four months. We can expect 3-6 more months before a new trend develops and this trend ought to be an uptrend because we are already experiencing a downtrend. The uptrend is defined as higher highs and higher lows. We want to ride the entire wave all the way to the top.
Sell high after buying low.
➖ Buy low —Q3/Q4 2024.
➖ Sell high —late 2025.
Easy, isn't it?
Get ready for the most profitable bull-market of your life.
Namaste.

STXUSDT 2DSTX ~ 2D
#STX Best strategy for COINBASE:STXUSD , Buy on breaking out of this descending pattern, or buy in the demand zone.

STX divided by Others DominanceOthers dominance represent dominance of altcoins excluding top 10.
This Stacks (STX) chart shows how strong this altcoin is.
Possible scenario if the FED cut rate in September and bull market resume.

STXUSDT: Previous Resistance Acting as Strong SupportSTX technical analysis update
STX's price is bouncing from its major support level, with the previous resistance now acting as strong support. Above this support zone, the price has formed a descending channel and is currently trading within it. The price is now moving toward the channel resistance, potentially setting up for a breakout.
Regards
Hexa
