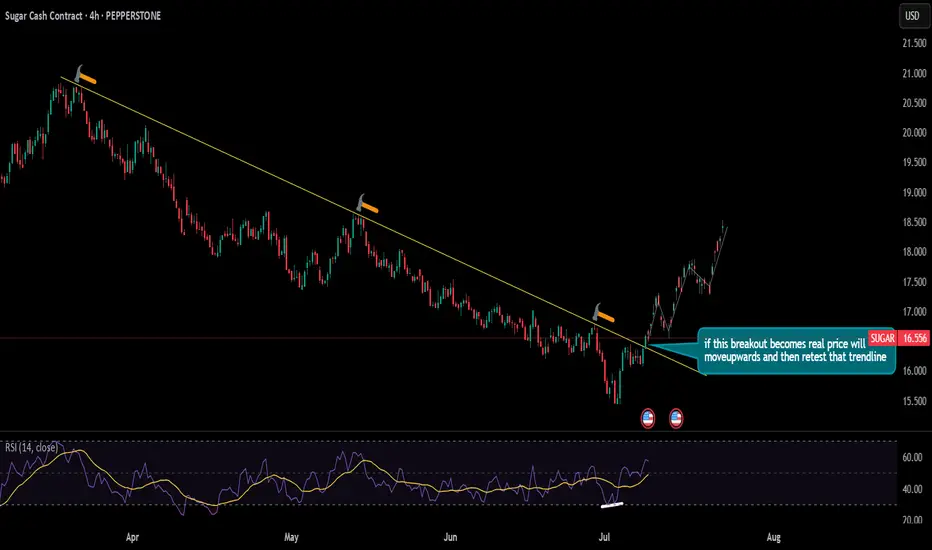
can we see price of SUGAR will increase in coming days??currently the price is breaking the trendline which was acting as strong resistance for some time. To confirm that this is reversal of trend we should and the price to retest that trendline which would be a major confluence of bullish trend
Sugar continue bearish but oversoldFOREXCOM:SUGAR Will continue go bearish but all indicators show that it is oversold. Waiting for the bullish monument and there will be a period of rolling back soon

Sugar Is In A Higher Degree Correction; Elliott Wave AnalysisSugar has been trading lower since 2023 when we spotted final wave V of an impulse on the weekly chart. So from Elliott wave perspective, it’s trading in a multi-year higher degree ABC corrective decline, where wave C can drop the price even down to 78,6% Fibonnaci retracement and 14-12 support area

Sugar (CFD) – Bullish Setup from a Key Demand Zone! 🔥 Sugar (CFD) – Bullish Setup from a Key Demand Zone! 🍬
Sugar is bouncing off a major demand zone, presenting a great risk/reward setup for a bullish move. With technical indicators signaling a reversal and fundamental tailwinds supporting higher prices, this could be a great swing trade opportunity

Sugar LongInto higher timeframe support on weekly chart.
The take profit is the moving average so will come lower over time.
Because trade is taken off a daily chart you will have to trail stop accordingly.

SUGAR Cash CFD Commodities Market Bullish Heist Plan🌟Hi! Hola! Ola! Bonjour! Hallo!🌟
Dear Money Makers & Thieves, 🤑 💰🐱👤
Based on 🔥Thief Trading style technical and fundamental analysis🔥, here is our master plan to heist the SUGAR Cash CFD Commodities Market market. Please adhere to the strategy I've outlined in the chart, which emphasizes long entr

Sugar Market: Higher U.S. Production and Global Trade ShiftsRising U.S. Sugar Production and Its Impact on Prices
In recent years, the United States has witnessed a notable increase in sugar production, driven by advancements in agricultural technology and favorable weather conditions. This growth has contributed to reduced reliance on imports, particularly

Raw Sugar vs US Dollar Quote | Chart & Forecast SummaryKey Indicators On Trade Set Up In General
1. Push Set Up
2. Range Set up
3. Break & Retest Set Up
Notes On Session
Raw Sugar vs US Dollar Quote
- Double Formation
* (Reversal Argument)) At 23.500 USD | Subdivision 1
* Trendline 1&2 | Descending Triangle Measurement
- Triple Formation
* Pattern Con

SUGAR LONG A superb long opportunity has emerged with an outstanding risk-to-reward ratio. The price is forming a double bottom pattern, signaling a potential reversal to the upside.
To account for market fluctuations, we recommend placing the stop loss slighly lower than usual for added safety.
Good luck to

Sugar Up for a Potential RallySugar prices have reached a strong demand zone around 1825–1830, a major support level. The price action suggests potential accumulation, with buyers likely stepping in. A rebound could target the 1983 level as the next resistance.
A sustained breakout above 1983 could open the door for further upsi

See all ideas
Displays a symbol's price movements over previous years to identify recurring trends.