SUGARUSD trade ideas

SugarUS LongSugar weekly candle just closed above the 20 ma and the 21 ema. Looking left when that occurred in the past we had at least one additional full body weekly candle close above those moving averages before trend reversal OR start of a further uptrend , especially in those cases that 21 ema crossed over the 20 ma to the upside.
Linking this idea with my previous long position on Sugar.

nice downtrending channel on Sugar!When will Sugar bounce off of this channel, and if soo, to the upside or downside?
Personally, I am still holding a short position from 0.1135.
Let's see when it will bounce back.. :)

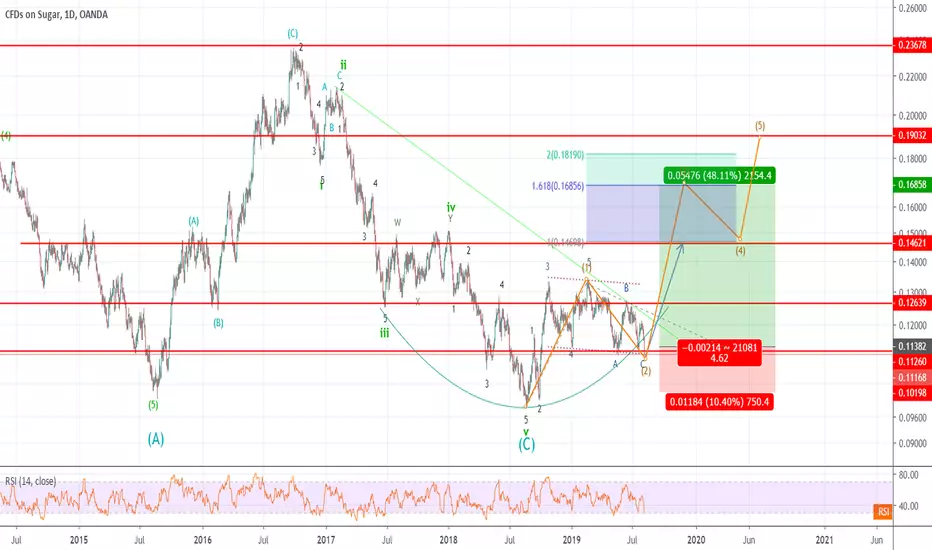
Sugar Long Term chart: Sweet, Then SourBeautiful structure as sugar price gonna complete the large correction to tag the multi-decade low of 0.0526
Wave C is 5 waves and it is in the second leg of wave 4 up before the last drop.

Bounce Off on the SUGARUSD priceHello Traders,
Price actions on the Sugarusd are showing reversal setup for upside.
Price can shoot to 0.15$.
Use Stop loss.
Trading involves risk on your invested capital.
Best Regards

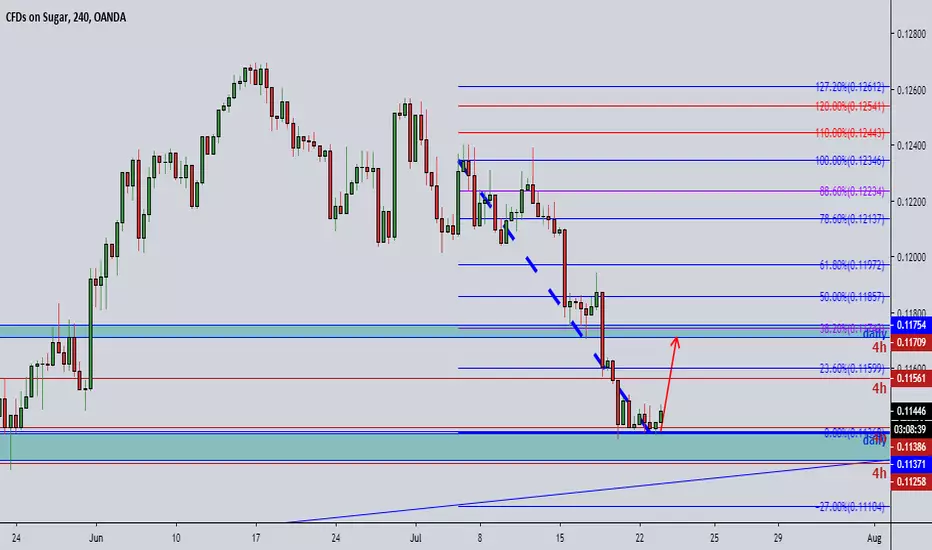
Sugar US Long Waiting for the price to break to the upside after consolidating inside the descending wedge
Negative momentum on the MACD decreases as price moves to lower lows -bullish divergence.
First target for profits the 0.12128 high to 0.11322 low 0.5 fib level
Second target the 0.12599 to 0.11322 low 0.5 fib level which happens to coincide with the 0.618 of the fibonacci mention above


Long term opportunitySugar is down and ready to complete B-wave as next big up move. Step in and sugar will pay you next sweet vacation :-)


SUGAR Still bullishHi Traders, we are still in bullish trend for sugar and we going to join the trend now. good luck


Sugar LongEnd of large degree correction, initial impulse seems to be an expanding triangle resting on support level. Imminent break of trend line resistance? Fibonacci extension of wave 1 to projected wave 2 and historical support and resistance suggest a target at the 0.19 mark to be expected after move higher into wave v then lower into higher degree wave 2.

Sugar looking sweeterWatching for a bounce at the support line 1155. Bearish indicators looking to bottom here soon. Getting ready for the buy signal.

Suggar Trend for the comming 30-45 days Suggar price is expected to fall until the mid of August after that it will redirect to up trend mostly until the begining of October.


SUGARUSD FlagAfter a strong rise in the price of sugar, the price is consolidated by forming a flag. As the flagpole is bullish, the exit will probably be bullish. And the bottom trend is bullish, everything makes us think about rising sugar in not very long.

SUGARUSD, Double Top + Bearish H&S CombinationSUGARUSD is currently consolidating at the peak of its uptrend, with clear resistance and support levels at 0.12506 and 0.12110 respectively. However, the formation of a Double Top pattern, along with a bearish Head and Shoulders pattern against the backdrop of the 2nd leg of the Double Top, suggest a strong possibility for a bearish reversal.
On the fundamentals, recent strengthening of the USD has seen commodities falling across the board. Possible bullish USD performance in the weeks ahead may see SUGARUSD breaking below support for a downtrend.
Trade: Enter when price breaks 1 ATR below support, at 1.11946. Set stop loss 1 ATR above support, at 1.12274.

Hello Traders, SUGAR/USD 0.12052 VS 0.12668. Trade SetupsHello Traders, SUGAR/USD 0.12052 VS 0.12668.
Looking for Yellow: a Break and continuation / corrective / Consolidation Pattern at 0.12546 / 0.12668
To Continue the upside movent towards 0.13120 / 0.3372.
Or Blue: Possible Completion Consolidation /Continuation / Corrective Pattern 0.12546
to Retest / Break previous Lows once more 0.12052 / 0.12080 towards 0.11827 / 0.11742.
