SugarUSDMy short term outlook on Sugar
Please use this TA as part of an informed trading decision before you execute any orders
SUGARUSD trade ideas
SUGAR/USD Sugar/USD trend based prediction
Please use this information as part of an informed decision from multiple sources to execute a trade


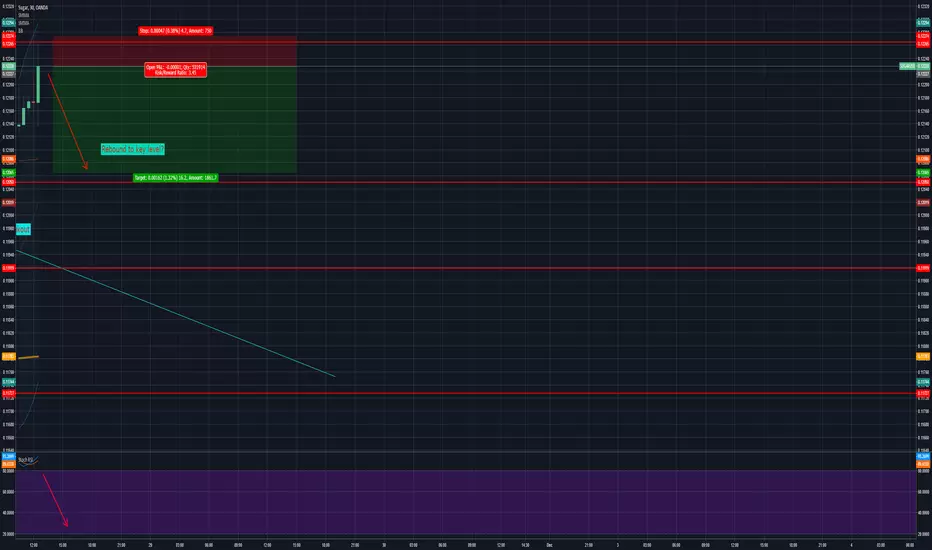
Sugar/USD - sweet bullish signals - good risk/reward ratioThe sugar price has broken the old trend line and with that the old bearish trend. I have drawn the new trend line which should be followed by an 1-2-3-4-5 Elliot Wave if the new trend line does not brake within the next week.
50D moving average has given strong bullish signals.
RSI & Stochastic RSI are both bullish and have a lot of space to grow.
MACD is giving small bearish signals but still no crossing of the two important base lines (orange and blue lines).
Bollinger bands reached downside, rebounce to the upside should follow soon.
I entered the market yesterday at 0,118 and set my take profit at 0,156. As soon as the price reach 0,135 (and brake this resistance) I will move my stop loss up to 1,129


Interesting situation on SUGARI preparing for signal to buy some sugar. Lets see how price will go in these days.

SUGAR BUY (SUGAR – US DOLLAR)Hi there. Price is forming a continuation pattern to the upside. Wait for the price to hit the bottom of the pattern and watch strong price action for buy.

SUGAR: new Weekly Demand zoneSugar price is very low in the curve, react on crossed Quarterly Demand zone, but not close yet and in the time created new Weekly Demand zone for potential longs.


Sugar LongSUGARUSD
Entry
-Above highs of pinbar
Stop
-Below lows of pinbar
Target
-2 times stop
Risk Management
-Risk 1% to 2%
-Ratio: 2:1

Sugar following the ABC Correction0.116 should be good level to reentry, fib 0.5 support, plus strong trend line support


Sugar (SUGAR/USD) Daily Chart Analysis 11/6Technical Analysis and Outlook
Sugar prices are closing steady to lower nearer the Mean Support 0.1236 each trading day. Profit taking may pull down the soft commodity to Key Support 0.1194 following striking a four-month high $1333 on Oct 24. The bears hold the over-all near-term technical edge, while, awaiting Sugar Dip $1165 to be fulfilled.

SUGAR BUYPrice is forming a continuation pattern to the upside. Wait for the price to hit the bottom of the pattern and watch strong price action for buy.
Don’t take a trade if you don’t see clearly when big guys are in.

sugar the new safe haven ? Stocks will bounce up , so sugar will retrace abit after a super strong impulsive wave , we should be now in wave 2
wave 3 will be a very nice long dont missout :)

Sugar (SUGAR/USD) Daily Chart Analysis 10/28Technical Analysis and Outlook
Sugar closed lower on Friday confirming intermediate Sugar Rally with Key Resistance 0.1312 . Expect profit taking pull down the soft commodity to Mean Support 0.1236 . Currently, the bears hold an over-all near-term technical edge, since the prices are in a retreat.


Sugar looks ripe for a correction.Candlesticks pattern looks like bulls' exhaustion here.
Looking at the weekly chart prices are confronting the alignment of Kijun and SSB flats extension.

Im calling this the top. We're going up with decreasing volume. Might see a lower low this time if we start breakingdown from here! Do not let this consolidation fool you


Sugar (SUGAR/USD) Daily Chart Analysis 10/18Technical Analysis and Outlook
Sugar closed at $1281 on Wednesday busting though Key Resistance $1268 . Prices are closing nearer the Sugar Rally $1327 each trading day. Profit taking may pull down the soft commodity to Mean Support $1236 following striking a four-month high $1302 today. The bulls hold the over-all near-term technical edge, since the prices are in a steep uptrend, as awaiting Sugar Rally $1327 will be struck any day.

Sugar (SUGAR/USD) Daily Chart Analysis 10/13Technical Analysis and Outlook
The Sugar finished higher for the second consecutive day with the completion of Sugar Rally $0.1232 in play since flagged by Trade selector Signal on Oct 1, as the commodity consolidates much higher range journey.
The stage for transforming from bullish by completing the move is signaling down prices are likely to occur in near term, with first Mean Support resting at $0.1194 , while very significant the Mean Support lies at $0.1116 . On the upside, there is major Key Resistance $0.1268 .
