SUGARUSD trade ideas


Largest H&S pattern of the century?Sugar now retreating to the ascending .105 support level.
Will this complete the head and shoulders pattern for a huge flush or bust?

!SUGARUSD Buy Position!Every crossover is targeted, no particular news that would affect sugars price. Because of the time of season for sugar the prices will increase due to growing seasons.
---------------------------------------------
CTF - SUGARUSD
Chart timeframe - 4hr
Area of interest - 1.4 , 1.8
Potential target 1 - 1.55
Potential target 2 - 1.675
Potential extended target - 1.75
---------------------------------------------
Trade Safe everyone!

Looks I need some sugar for coffee :D Soft Commodities looking for longer term investment, as $ as weakening is great opportunity.

Sugar looking sweet on the DailySideways head and shoulders pattern developing. Ideally, we see a retracement into dashed line below 1370 but looks like we're about to breakout.

HEAD AND SHOULDERS PATTERNWe have possible inv head and shoulders pattern in development on daily timeframe.
It would be a good idea to entry after breakout of necklinme and aim at least to targets as maked on chart.


SugarMarket is approaching the DTL. WIll be watching the price action around this DTL next week with great interest.
DTL and 200EMA are pointing to bearish bias.
A break and close above DTL may indicate potential trend change.
Keeping an open mind at this moment.


Sugar Long - finally bottoming?Nice candle today if gains hold. First minor downtrend broken. Oversold on larger timeframes (daily, weekly, even monthly)
COT bullish -> MM / Large Specs short, Commercials long
Wait for current extreme to cool down ~ +5% and look for long entry. SL below the lows.
Good Trading!

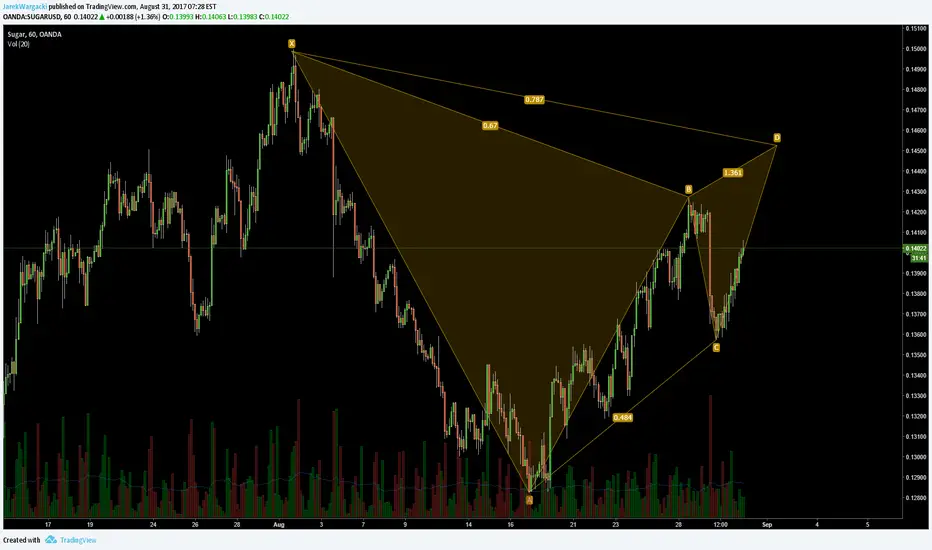
SUGAR Commodity LONG- Advanced Pattern formation of Bat completion at D leg at 88% fib
- Structure to the left
- Potential double bottom at daily chart
- Fundamental news of 2017 May of Sugar and World Markets and Trade stating record global production keeps consumption of Sugar near record high.
- RSI divergence upwards


Looks like a Swiss zucker job openingThe world's #1 Sugar trading firm puked up it's head, I'll take the gig -- Did I mention I come from the land of Cargill


SUGAR: Heading down for new lowsSugar is in a very strong downtrend. I think soon it's about to test the Feb-2016 Low and then maybe even go to new lows.


