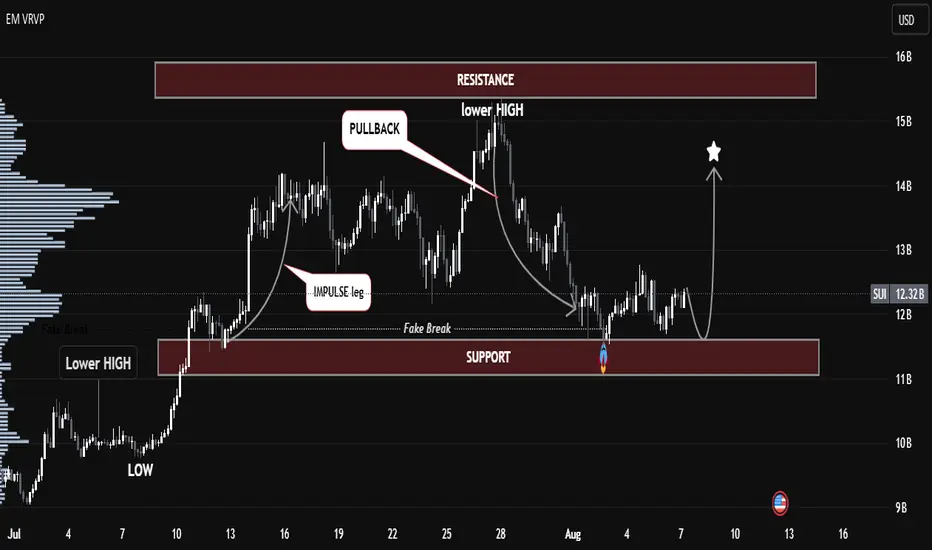
SUI/USDT – Smart Money Accumulation at Key Demand Zone📊 SUI/USDT – Smart Money Accumulation at Key Demand Zone | Bullish Outlook Ahead 🚀
The current SUI/USDT structure highlights a textbook Smart Money accumulation phase playing out at a key support zone, following a clear impulse–pullback–lower high formation.
🔍 Key Technical Insights:
🔻 Lower Highs
Key data points
Previous close
—
Open
—
Day's range
—
About Market Cap SUI, $
Coin
SUI Market Cap Analysis with Fibonacci Levels and Price Predict
Description:
📈 Market Cap Overview
Current Market Cap: $14.49B
Fibonacci Levels indicate potential price movements with strong support and resistance levels.
📊 Key Analysis:
Fibonacci Levels:
0.236: $2.73B
0.382: $4.24B
0.5: $6.26B
0.618: $9.25B
0.786: $16.1B
1.0: $32.64B (Major Resistance)
Ch

INVERSE HEAD AND SHOULDERSInverse head and shoulders pattern on 4h SUI chart.
Very long term bullish on this one!

crypto investments for a better future, market capture of suihere a place to drop a look on sui market cap to help you decide weather to invest or not invest in alternative crypto currencies

See all ideas
Summarizing what the indicators are suggesting.
Oscillators
Neutral
SellBuy
Strong sellStrong buy
Strong sellSellNeutralBuyStrong buy
Oscillators
Neutral
SellBuy
Strong sellStrong buy
Strong sellSellNeutralBuyStrong buy
Summary
Neutral
SellBuy
Strong sellStrong buy
Strong sellSellNeutralBuyStrong buy
Summary
Neutral
SellBuy
Strong sellStrong buy
Strong sellSellNeutralBuyStrong buy
Summary
Neutral
SellBuy
Strong sellStrong buy
Strong sellSellNeutralBuyStrong buy
Moving Averages
Neutral
SellBuy
Strong sellStrong buy
Strong sellSellNeutralBuyStrong buy
Moving Averages
Neutral
SellBuy
Strong sellStrong buy
Strong sellSellNeutralBuyStrong buy
Displays a symbol's price movements over previous years to identify recurring trends.