SUI/USDT – Smart Money Accumulation at Key Demand Zone📊 SUI/USDT – Smart Money Accumulation at Key Demand Zone | Bullish Outlook Ahead 🚀
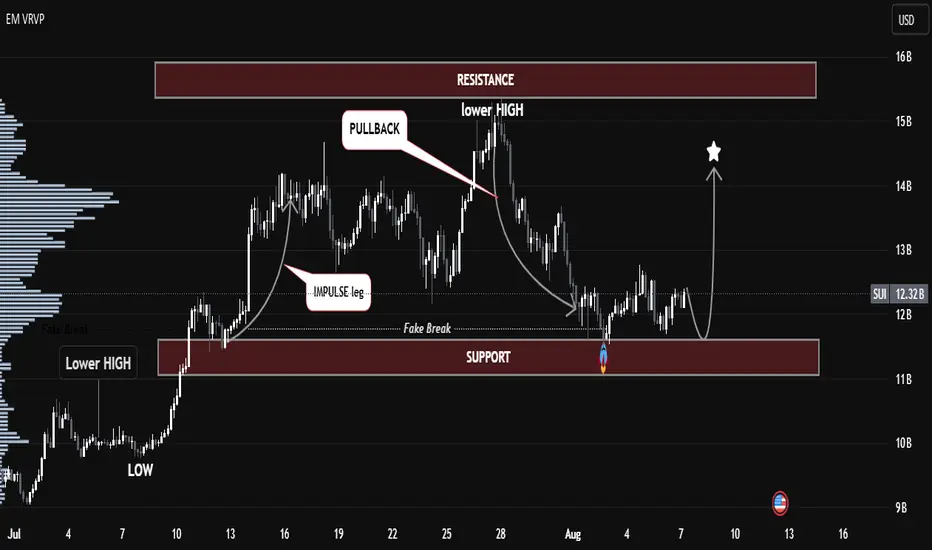
The current SUI/USDT structure highlights a textbook Smart Money accumulation phase playing out at a key support zone, following a clear impulse–pullback–lower high formation.
🔍 Key Technical Insights:
🔻 Lower Highs Formation: A strong bearish structure led price back into the previous demand zone, sweeping liquidity below the support.
🎭 Fake Break Identified: Price action broke below the support briefly, indicating a liquidity grab (stop-hunt), often a precursor to bullish reversals.
🌀 Volume Node Alignment: Strong volume interest is building at the current support area, adding confluence for potential accumulation.
⚡ Projection Path: If the demand holds, expect a potential bullish reversal, targeting the previous resistance zone between 14–15B.
🧠 SMC Concepts in Play:
Fake Breakout = Liquidity Sweep
Impulse Leg = Institutional Activity
Pullback = Re-Entry for Smart Money
📈 Bullish Scenario:
Watch for confirmation around the support zone (~11B). A higher low or bullish engulfing pattern could trigger a rally toward 14B–15B resistance.
🛑 Bearish Invalidator:
A clean break and close below the 11B zone would invalidate the current bullish thesis.
SUI trade ideas
SUI Market Cap Analysis with Fibonacci Levels and Price Predict
Description:
📈 Market Cap Overview
Current Market Cap: $14.49B
Fibonacci Levels indicate potential price movements with strong support and resistance levels.
📊 Key Analysis:
Fibonacci Levels:
0.236: $2.73B
0.382: $4.24B
0.5: $6.26B
0.618: $9.25B
0.786: $16.1B
1.0: $32.64B (Major Resistance)
Channel Trend:
Strong upward channel trend signals a bullish continuation.
Price is moving within the channel with momentum targeting higher levels.
Price Projection at $32.64B:
Circulating Supply: 3,009,569,341.53 SUI
Calculated Price: ~ $10.85 - $12 USD
📌 Trading Strategy:
Watch for key support levels at $9.25B (0.618) and $6.26B (0.5).
Look for a breakout beyond $32.64B, targeting Fibonacci Extension at 1.618 ($251.26B).
Use volume analysis to confirm upward momentum.
💡 Conclusion:
SUI shows strong bullish potential within the channel.
Investors should monitor Fibonacci levels for potential entry/exit points.
💬 Share your thoughts in the comments below! Let's discuss your strategy for SUI! 🚀
Tags:
#SUI #Fibonacci #MarketCap #CryptoAnalysis #BullishTrend #PricePrediction #TradingView

INVERSE HEAD AND SHOULDERSInverse head and shoulders pattern on 4h SUI chart.
Very long term bullish on this one!

crypto investments for a better future, market capture of suihere a place to drop a look on sui market cap to help you decide weather to invest or not invest in alternative crypto currencies
