SUI new trend started!SUI / USDT
Price broke out after long accumulation range with good volume
Looks like a new bullish trend has started
Trading activity
Transactions 5.52 K
BuysSells
3.04 K2.48 K
Volume 13.31 MUSD
Buys volumeSells volume
7.58 M5.73 M
Traders 566
BuyersSellers
280286
About SUIUSDC_15DBCA.USD
Related DEX pairs

Sui - next target Sui is following Eth as most alts do.
Just an update on July 23rds chart targets (seen from a different lense).

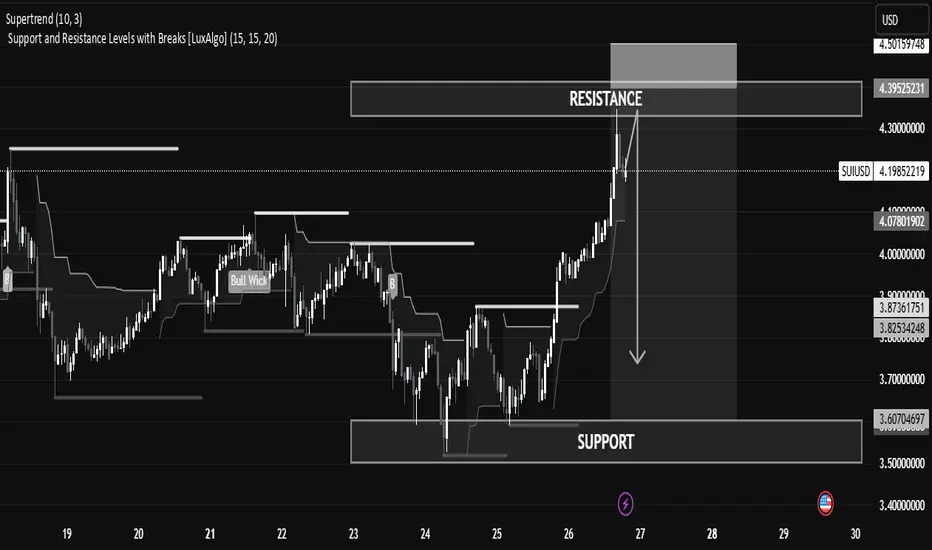
SUI/USD Technical Analysis – Potential Reversal Zone IdentifiedSUI/USD Technical Analysis – Potential Reversal Zone Identified
The current SUI/USD price action shows a strong bullish impulse reaching into a well-defined resistance zone, suggesting a potential pullback or reversal in the short term.
🔍 Key Levels
Resistance Zone: Between 4.30 – 4.39 USD, current
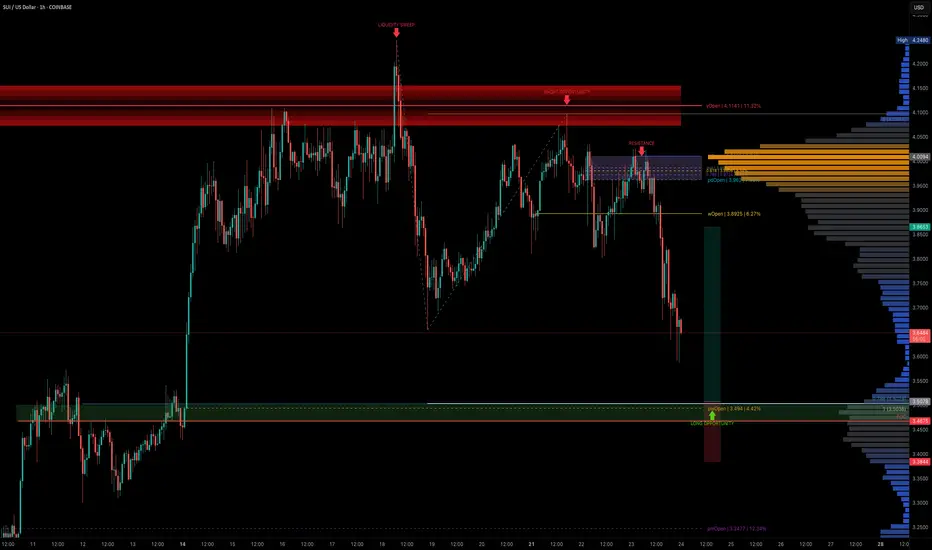
SUI — Structured Dip Buy Zone You Shouldn't IgnoreSUI has been technically clean, with well-respected Elliott Wave counts and fib levels.
As the broader market dips, it's time to look for sniper long entries and SUI is setting up beautifully for one around the $3.50 zone.
🧩 Key Confluence Zone: $3.50
This level offers a high-probability buy zo
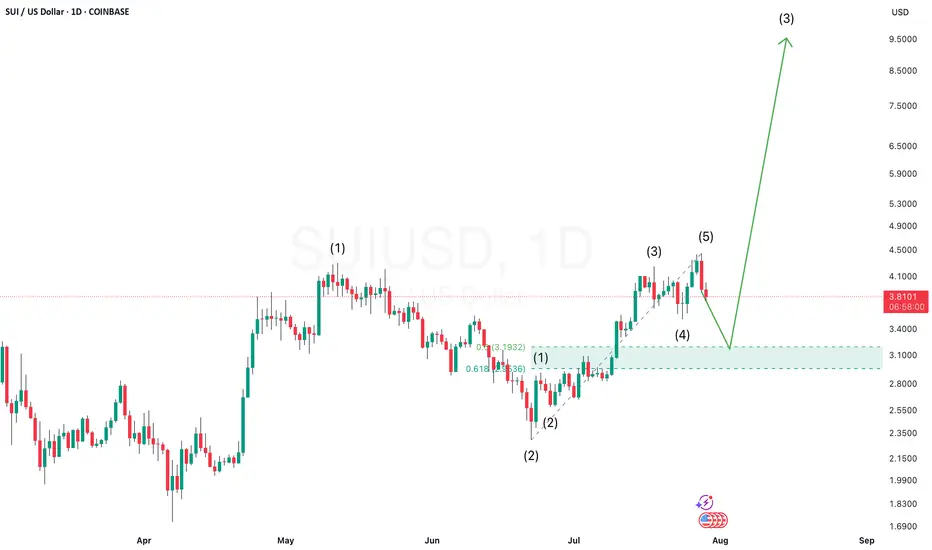
SUIUSD Setting Up for a Potential 1-2, 1-2 Pattern — Wave 3 BlasSUIUSD appears to be forming a classic 1-2, 1-2 Elliott Wave setup — a bullish structure that often precedes an explosive third wave rally.
In this pattern, we first see a motive Wave 1 followed by a corrective Wave 2, then another smaller-degree Wave 1 and 2 within the larger Wave 3. This kind of
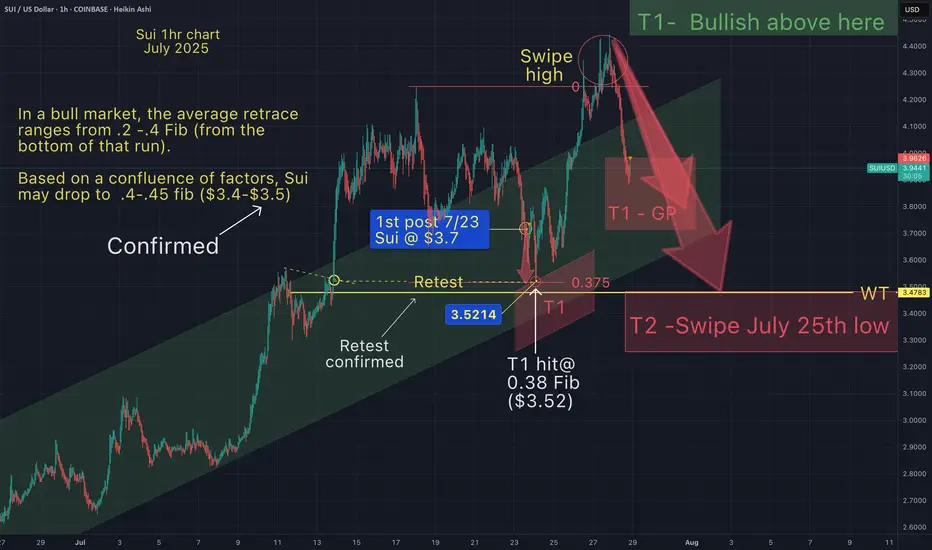
Sui next target (T2)As anticipated Sui would drop somewhere between the .2-.4 Fib (of the entire run).
As shown on the chart, Sui has hit the 3.8 Fib.
This was also expected because of the dotted yellow line indicating a breakout retest.
Also my price prediction on 7/23/25 was between $3.4 - $3.5.
So far Sui has hi
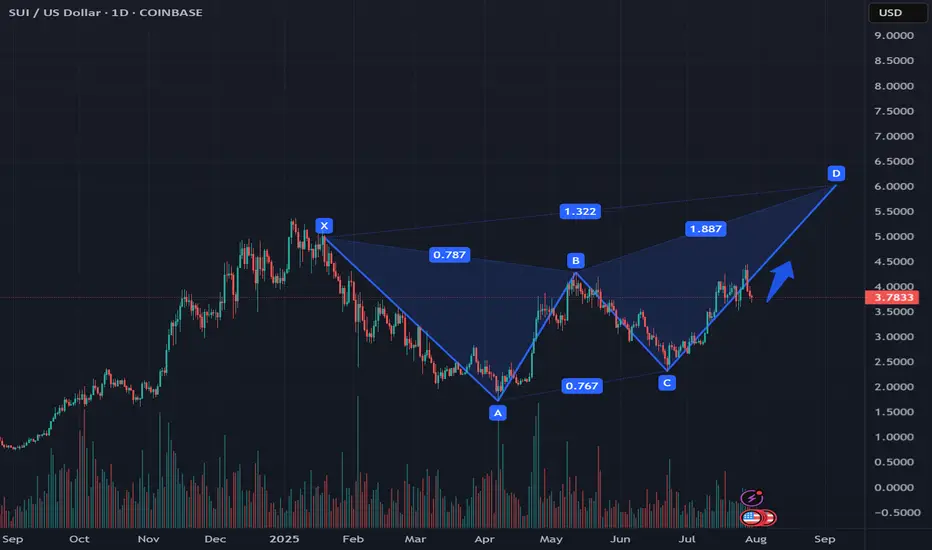
SUI Completes Butterfly Pattern: Possible Bullish Continuation According to the previous analysis, SUI successfully completed the butterfly pattern.
According to the pattern, an upward movement is expected to the nearest $3.95 zone and possibly $4.1
Also, according to the pattern, a rollback to the $3.3 zone is unlikely
This analysis is based on the t
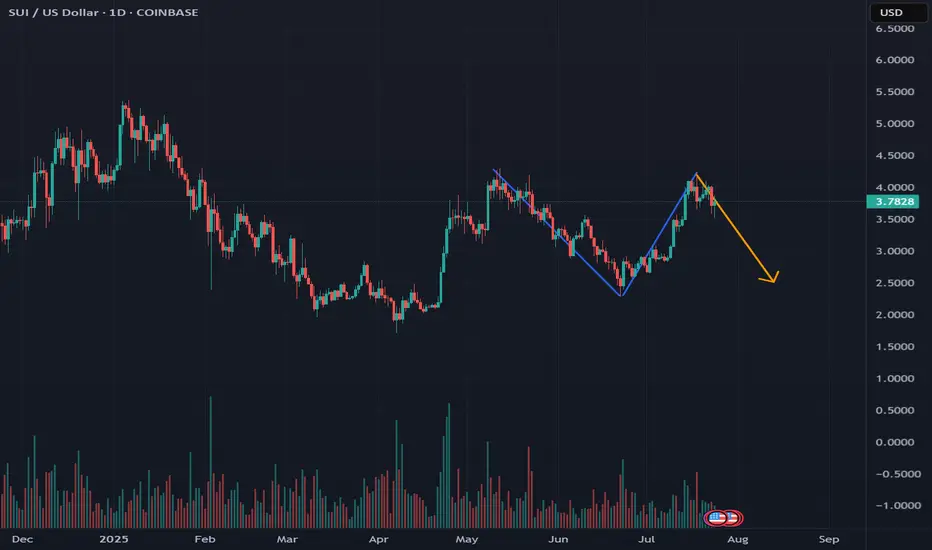
SUI Forms W or Butterfly Pattern: Potential Downward Move ExpectOn the global SUI CRYPTOCAP:SUI chart, a W or butterfly pattern is emerging, according to both patterns, the movement is likely to go down
The market is also returning to previous prices, but the liquidity gap has not yet formed on the dollar dominance chart, most likely another strait in the pri
SUIUSD – Snapped Trend, Needs FuelSUI launched off $3.62 support, breaking trendline and 200 SMA around $3.81, reaching $3.95. RSI got hot (~63) and now turning. It’s pausing under resistance, forming a potential flag. $3.89 is key support to hold for next push. Below that risks retracing deeper.

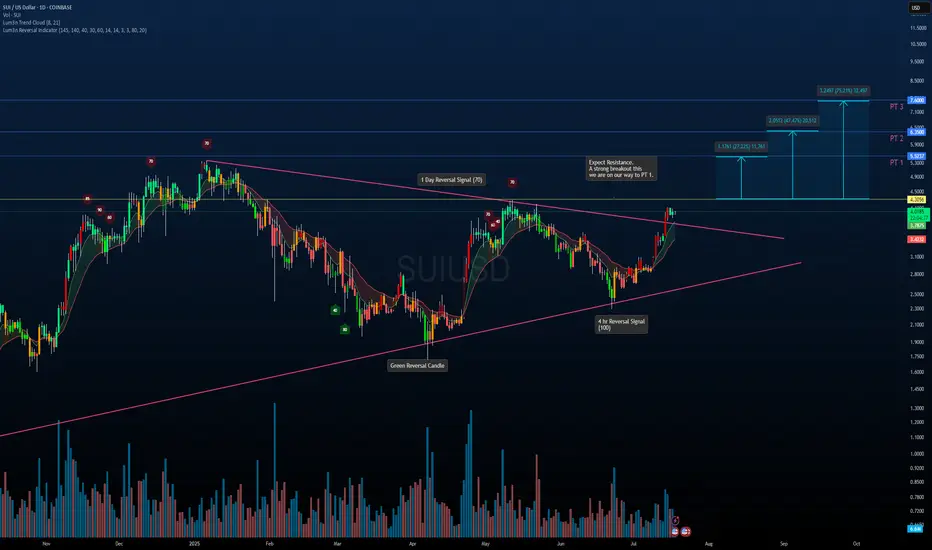
SUI/USDT – Symmetrical Triangle Breakout in PlaySUI has officially broken out of a multi-month symmetrical triangle on strong momentum. This structure has been building since early 2024 and now looks ready for continuation.
Key Notes:
Breakout confirmed above trendline resistance with strong volume.
Reversal signals on the 1D and 4H timeframes a
See all ideas
Summarizing what the indicators are suggesting.
Oscillators
Neutral
SellBuy
Strong sellStrong buy
Strong sellSellNeutralBuyStrong buy
Oscillators
Neutral
SellBuy
Strong sellStrong buy
Strong sellSellNeutralBuyStrong buy
Summary
Neutral
SellBuy
Strong sellStrong buy
Strong sellSellNeutralBuyStrong buy
Summary
Neutral
SellBuy
Strong sellStrong buy
Strong sellSellNeutralBuyStrong buy
Summary
Neutral
SellBuy
Strong sellStrong buy
Strong sellSellNeutralBuyStrong buy
Moving Averages
Neutral
SellBuy
Strong sellStrong buy
Strong sellSellNeutralBuyStrong buy
Moving Averages
Neutral
SellBuy
Strong sellStrong buy
Strong sellSellNeutralBuyStrong buy