SUI Rebuy Setup (12H)After forming a 3D pattern at the top, wave E of a higher-degree pattern has completed.
A new leg has formed from the point marked by the red arrow on the chart.
It seems that wave E will end in the green zone, followed by a strong upward reversal.
Truthfully, there are other support levels above our marked zone, but we have identified the most important one. If the price reaches this level, we can take a safe buy on SUI.
This project is one of the strongest in crypto, but we always manage risk.
For risk management, please don't forget stop loss and capital management
When we reach the first target, save some profit and then change the stop to entry
Comment if you have any questions
Thank You
SUIUSDT trade ideas

#SUI/USDT#SUI
The price is moving within a descending channel on the 1-hour frame, adhering well to it, and is heading for a strong breakout and retest.
We are seeing a bounce from the lower boundary of the descending channel, which is support at 1.86.
We have a downtrend on the RSI indicator that is about to be broken and retested, supporting the upward trend.
We are looking for stability above the 100 Moving Average.
Entry price: 1.90
First target: 1.99
Second target: 2.10
Third target: 2.19

Short SUIA correction of the major bearish trend on SUI stopper around 0.618 Fib level. A continuation of the descending trend to Fib. 1 level is expected to happen

SUI is expected to have a 50% pump ahead (1D)SUI, after completing the 3D pattern at its price peak, has entered a corrective phase.
It is now approaching a high-potential zone, which is the origin of a strong move with significant buy orders. We are looking for buy/long positions in the demand zone.
The target could be the supply zone.
A daily candle closing below the invalidation level will invalidate our bullish outlook.
Do not enter the position without capital management and stop setting
Comment if you have any questions
thank you

SUI Long Spot Trade Setup – Support Zone EntrySUI is retracing into a key support level around $2.00, providing a potential high-reward swing setup if buyers defend this zone.
📌 Trade Details:
Entry: ~$2.00
Take Profit Targets:
🥇 $2.50 – $2.90
🥈 $3.25 – $3.60
Stop Loss: Just below $1.60

Will SUI break $2 support and drop 20% to $1.80?Hello and greetings to all the crypto enthusiasts, ✌
let’s dive into a full analysis of the upcoming price potential for SUI 🔍📈.
SUI is currently trading within a downward channel, signaling a potential continuation of its bearish trend. A decline of at least 20% appears likely, with the primary target set at $1.80, provided that the critical psychological support at $2 is decisively broken. If this key level fails to hold, increased selling pressure could drive the price lower, reinforcing the downtrend.📚🙌
🧨 Our team's main opinion is: 🧨
SUI is stuck in a downtrend, and if it breaks below the key $2 support, we could see at least a 20% drop, with $1.80 as the main target.📚🎇
Give me some energy !!
✨We invest hours crafting valuable ideas, and your support means everything—feel free to ask questions in the comments! 😊💬
Cheers, Mad Whale. 🐋

SUI-USDT Analysis: Watching Key Support at $1.75Hello Traders,
The price of SUI-USDT has been locked in a consistent downtrend, marked by a series of lower highs and lower lows. However, the asset is now testing a critical support level that could determine whether we see a relief bounce or a continuation of the decline.
Key Highlights:
• Price is approaching $1.75, a major support zone with confluence from the Value Area Low (VAL), HTF support, and a possible Swing Failure Pattern (SFP).
• If this level holds, there’s potential for a relief rally up to $2.78 over the coming days.
• A break below $1.75 opens the door to a deeper pullback toward $0.57, the next significant support.
SUI is currently sitting at support, and while it’s possible to see short-term candle closes above this region, confirmation is still needed before any strong bullish bias can be adopted. This is a level where patience and discipline will pay off — entering prematurely could result in getting trapped in a deeper leg down.
Overall, the market structure remains bearish. Unless the pattern of lower highs and lower lows is broken, momentum will continue to favor the downside. Holding $1.75 is crucial for any chance at a rotation higher.

SUI is approaching a key support zone...
The price has already dropped by -74% from the top — and if it reaches the $1.00–$1.40 area, it could be a potential entry signal, just like it was before after a ~70% correction.
🔁 History doesn’t repeat, but it often rhymes.
An interesting level to watch — no need to rush, just be ready.
⚠️ Risk management is everything.

We are at wave 4!Sui is completing a five-wave movement. It is currently completing wave 4 and it is very essential that it does not lose ~$2.2-$2.0. If it does not lose this level it has the potential to pump to about ~$7. Otherwise it will correct to at least ~$1.6.

SUI/USDT Is a Trend Reversal on the Horizon?1D CHART of SUI on USDT market pair. indicates a potential trend reversal following a prolonged downtrend within a descending parallel channel. The price has consistently formed lower highs and lower lows, indicating strong bearish momentum. However, a recent breakout from the channel suggests a possible shift towards bullish price action.
A critical support zone around $2.00 has shown significance, as buyers have stepped in to defend this level, preventing further declines.
This breakout signals a potential trend change, with the price now targeting key resistance levels at $2.9357, $3.5131, and $4.2060. In an extended bullish scenario, the price could reach as high as $4.7538.

#SUI/USDT#SUI
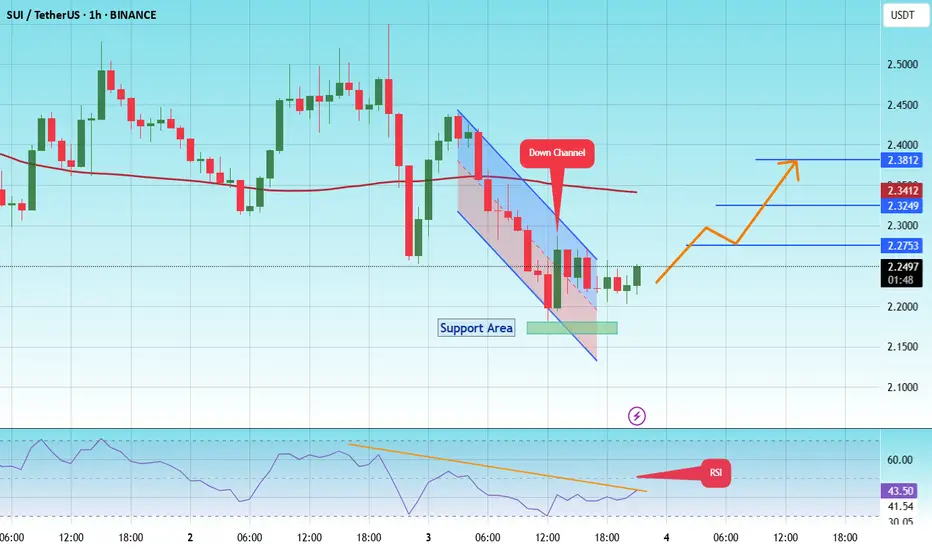
The price is moving in a descending channel on the 1-hour frame and is expected to continue upward.
We have a trend to stabilize above the 100 moving average once again.
We have a downtrend on the RSI indicator, supporting the upward move with a breakout.
We have a support area at the lower boundary of the channel at 2.17.
Entry price: 2.24
First target: 2.27
Second target: 2.32
Third target: 2.38
Sui Bear Flag !! Big Cluster liquidity area
Bearish Continuation Trade Idea - Potential Breakdown from Bear Flag
📉 Market Outlook:
The price has been in a strong downtrend, forming a bear flag after an impulsive move downward. This pattern is typically a continuation signal, suggesting further downside if the price breaks below the flag structure.
📍 Key Observations:
1️⃣ Big Cluster Liquidity Area: The highlighted zone marks an area where the price previously accumulated/distributed liquidity before a strong breakout. Now that the price has fallen below this region, it is acting as a major resistance.
2️⃣ Bear Flag Formation: After a steep decline, the price is moving inside a narrow ascending channel, which often acts as a bearish continuation pattern.
3️⃣ Potential Breakdown: A clear break below the lower boundary of the flag could confirm the next leg down.
🔴 Trade Plan (Short Setup):
Entry Trigger: Wait for a confirmed breakdown below the bear flag's lower boundary, ideally with a strong bearish candle close.
Stop Loss: Place above the recent swing high inside the flag to limit risk.
Take Profit Targets:
First target: Recent swing low
Second target: Major support zone with historical liquidity
⚠️ Risk Management:
Position sizing should align with your risk tolerance.
Beware of false breakouts; a confirmed breakdown with strong momentum is preferred.
Monitor macroeconomic events that might cause volatility.
📌 Conclusion:
The overall trend remains bearish, and the formation of a bear flag suggests further downside if confirmed. If the price breaks lower with conviction, sellers may push it toward key support levels.
🔔 Disclaimer: This is NOT financial advice. Always conduct your own analysis and manage risk accordingly.
Would love to hear your thoughts—drop a comment below! 🚀🔥

SUIUSD I Weekly CLS, Key level - OB I Model 2, Multiple targetsHey Traders!!
Feel free to share your thoughts, charts, and questions in the comments below—I'm about fostering constructive, positive discussions!
🧩 What is CLS?
CLS represents the "smart money" across all markets. It brings together the capital from the largest investment and central banks, boasting a daily volume of over 6.5 trillion.
✅By understanding how CLS operates—its specific modes and timings—you gain a powerful edge with more precise entries and well-defined targets.
🛡️Follow me and take a closer look at Models 1 and 2.
These models are key to unlocking the market's potential and can guide you toward smarter trading decisions.
📍Remember, no strategy offers a 100%-win rate—trading is a journey of constant learning and improvement. While our approaches often yield strong profits, occasional setbacks are part of the process. Embrace every experience as an opportunity to refine your skills and grow.
Wishing you continued success on your trading journey. May this educational post inspire you to become an even better trader!
“Adapt what is useful, reject what is useless, and add what is specifically your own.”
David Perk ⚔

SUI ready to provide structure? Be prepared for downside.SUI is at a good level, to get some support. There are further levels to get support below. However, a pivot structure can be built here. Momentum has room to get further oversold, but some downsides could still happen. DCA is the best strategy.
Full TA: Link in the BIO

SUI x10 in 3 months SUI is one of the few cryptocurrencies that has managed to maintain a bullish pattern in this abominable cycle. Time is 2nd quarter of 2025
Target $20+
Stop 20%
Invest 5% depo
Risk / Profit 1:50 🔥

#SUIusdtThe period of growth and show-off of this coin is over. Coins that are not American and try to attach themselves to America are not worth investing in.
And any coin that starts negotiating with Trump to enter the American market will soon disappear.
And experience has proven that any coin that gets close to Trump is doomed to pay him a ransom for growth and will disappear when he finishes paying the ransom.

SUIUSDT Trade IdeaHello guys!
This is my idea about SUI/USDT.
Of course, this is not financial advice, but I’d like to share my opinion on this coin ‘cause I want to see how future me reacts to it. XD
If you use this idea, let me know in the comments—it makes me happy <3

sui usdt ready to lead ALTS?Looking to long SUI as close to 2.4 as possible
Reclaimed key support level after forming A&E pattern
Above 50 level on both 4h and 12h rsi
Was the fastest horse of the market when the market started its trend in 2024. Should lead again
Broke out of the trendline after the fakeout. Usually fakeout --> retest support --> real breakout occurs

SUI/USDT:BUY LIMITHello friends
Due to the heavy price drop, it can be seen that the buyers have supported the price well at the specified support and by hitting higher ceilings and floors, they are giving us a sign that they have good strength. Now we can buy in steps with capital and risk management and move to the specified targets.
Don't forget to save profit on each target.
*Trade safely with us*

SuiUsdt Trade setup 12-15% upside ??recent impluse momentum with a formation of HL on 1h could be a sign of trend change
trade entry at2.300 to 2.350 demand zone further up at 2.5 can be the potential pullback area and could then face resistance at 2.65
and considering the down side risk at 2.200 can be the stop loss as it is recent low that bulls will try to defend

#SUI/USDT#SUI
The price is moving within a descending channel on the 1-hour frame and is expected to continue lower.
We have a trend to stabilize below the 100 moving average once again.
We have a downtrend on the RSI indicator, supporting the upward move with a break above it.
We have a resistance area at the upper limit of the channel at 2.55.
Entry price: 2.52
First target: 2.40
Second target: 2.32
Third target: 2.20

SUI/USDT long/buyBy utilizing Fibonacci retracement levels, historical patterns, , we can formulate a hypothesis that the market might follow a similar trajectory if bullish sentiment prevails.

SUI ON BULLISH -> $10+ Important Note: Trading involves risk, and this analysis is based on the provided chart and description. Traders should conduct their own thorough research and analysis before making any trading decisions. Remember to confirm the timeframe and adjust the stop loss based on your own risk management strategy.
