SUI's bullish cycle might not end soon!BINANCE:SUIUSDT
SUI is in a bullish channel and to our surprise, the channel has been reliable for the past 2 months! so we can still rely on it!
the price shall bounce in it for now!
No sign on bearish signals can be seen!
⚠️ Disclaimer:
This is not financial advice. Always manage your risks and trade responsibly.
👉 Follow me for daily updates,
💬 Comment and like to share your thoughts,
📌 And check the link in my bio for even more resources!
Let’s navigate the markets together—join the journey today! 💹✨
SUIUSDT trade ideas

Huge Resistance in the 5.2 - 5.4 zone - Rally or selloff? If BYBIT:SUIUSDT.P can break through the resistance relatively smoothly, we'll be in for a rally, as that is clear proof of strength from the bulls. However we may also see a break and consolidation. Also likely there is a huge selloff that awaits there.
Act with the market reaction in that zone.

CGPT - Just Got Listed On Binance MartyBoots here , I have been trading for 17 years and sharing my thoughts on CGPT here.
CGPT is looking beautiful , very strong chart for more upside
Very similar to SUI which mooned from similar chart structure
Do not miss out on CGPT as this is a great opportunity
Watch video for more details
ChainGPT (CGPT) is an AI-powered platform launched in April 2023 that offers a suite of blockchain solutions, including chatbots, NFT generators, and smart contract tools.
Its native cryptocurrency, CGPT, is used to access various AI tools and products within the ecosystem. As of January 11, 2025, CGPT is trading at approximately $0.2129, with a market capitalization around $169 million and a circulating supply of about 795 million tokens.
Recently, CGPT has gained attention due to its listing on major exchanges like Binance, reflecting its growing prominence in the AI and blockchain sectors.

SUI/USDT | 4-Hour Resistance Zone Short SetupThis setup for SUI/USDT on the 4-hour timeframe highlights a potential rejection from a key resistance zone. Here's the trade idea:
Entry: Around $5.081, targeting the red resistance zone at $5.0252.
Stop-Loss: Above the resistance zone, allowing for potential wicks.
Take-Profit: Targeting $4.7629, which aligns with a strong support area.
This strategy assumes a pullback or rejection from the resistance zone with sellers dominating at this level. Monitor price action and volume for confirmation of the reversal. Suggestions for refinements are welcome!

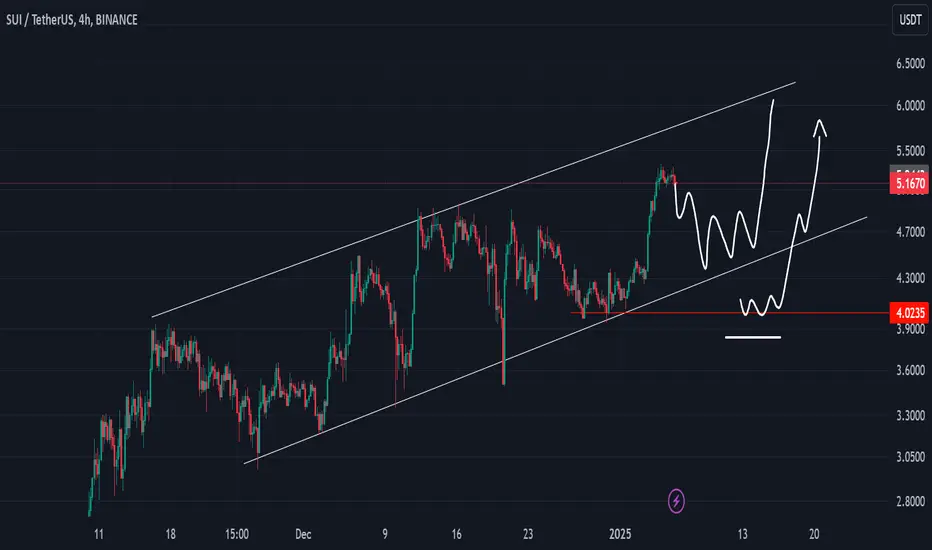
SUI Holding Strong Above Key Levels: Bulls Target $6.00SUI/USDT is maintaining its bullish momentum, holding strong above the rising trendline and within the ascending channel. This indicates steady demand, with each retracement finding support near the trendline.
The key support zone lies around $3.8-$3.9, providing a strong base for potential reversals if a pullback occurs. On the upside, breaking above the $5.50 resistance could signal further bullish continuation toward $6.00 or higher.

Public trade #6 - #SUI price analysis So far, the CRYPTOCAP:SUI price is holding up quite well, despite the correction in the crypto market.
So we have a quick question for you on the OKX:SUIUSDT price:
🐳 - a slight correction to $4 and then continued growth to $7.5
or
💔 - below $4, the beginning of a sawtooth correction to the region of $2 - $2.30
_____________________
Did you like our analysis? Leave a comment, like, and follow to get more

SUIUSDT 1DSUI Update ~ 1D
#SUI The Layer 1 winner in 2025 will be CRYPTOCAP:SUI , This is indisputable. #SUI Will be a new player in the TOP 10 Marketcap #Crypto


SUIUSDT | Bull Flag Confirming Uptrend ? Overview
SUIUSDT is currently showing a strong Bull Flag pattern on the daily chart (1D), which often acts as a continuation signal in an uptrend. After a powerful rally, the price is consolidating within a narrow descending channel (highlighted in yellow), preparing for a potential breakout.
Key Levels
Support Levels:
100% Fibonacci (2.2884): Critical support to maintain the uptrend.
88.6% Fibonacci (2.0758): Secondary support zone if price retraces deeper.
Resistance Levels:
Target for Bull Flag Breakout: 4.5996.
161.8% Fibonacci (3.4087): Intermediate target on the way to the Bull Flag breakout target.
200% Fibonacci (4.1043): Another key resistance before reaching the final target.
Bull Flag Setup
Pattern: The current consolidation (highlighted in yellow) forms a textbook Bull Flag.
Breakout Potential: A breakout above the flag’s upper boundary signals a continuation of the uptrend. Target levels align with Fibonacci extensions, with the ultimate target at 4.5996.
Volume: Watch for increased buying volume on the breakout to confirm the move.
Scenario Analysis
Bullish Case:
If the price breaks the upper trendline of the flag and holds above, the next targets are:
3.4087 (161.8% Fibonacci) as the first intermediate target.
4.1043 (200% Fibonacci) as a secondary resistance.
4.5996 as the projected breakout target.
Bearish Case:
If the price fails to hold above 2.2884, the uptrend may weaken, and a deeper retracement toward 2.0758 could occur.
Trading Plan
Entry: Break and close above the Bull Flag with volume confirmation.
Stop Loss: Below the lower boundary of the flag or 2.2884 (100% Fib).
Target 1: 3.4087 (161.8% Fib).
Target 2: 4.1043 (200% Fib).
Final Target: 4.5996.
📌 Disclaimer: This analysis is for educational purposes only. Always manage your risk and conduct your own research before trading.


SUI - SUUU SUUUII is pretty dope, analysis marked to show what can happen or not,ok? bascially looks good to buy from point marked in red,

SUI hidden patternSUI / USDT
Price is playing inside ascending broadening wedge pattern since last September!
Where close to lower trendline act as support and near upper trendline act as resistance
If you noticed this pattern marks out the bottoms and tops for all market in the same period
Which is normal thing for SUI as market leader in this cycle
Will this pattern work out again ?
Lets see the reaction at support and see 👀
Lower support must hold otherwise deeper correction will occur

SUI retracement to $3 or $4
If SUI break $4, we may see $3.
SUI upside moves are so quick that it can invalidate this chart anytime :).

SUI Ascending ChannelAfter break psychologycal level at $5 with channel trend its good to has correction around $4.3
But maybe can doing fakeout in $4 then massive upside
SUI key pointsWhile the market is shaking and the SUI has taken off well, I will consider buying piecemeal at levels 3.5-3 and 2. Remember, a fall is an opportunity, the main thing is to properly allocate funds.

SUI price discovery long trade setupSUI price discovery long trade setup. SUI has been the darling of the bull run and I don't see it stopping any time soon. Here's a nice setup with golden pocket and daily pivot support levels.

SUI USDTCRYPTOCAP:SUI #SUI
The token is holding firmly within its ascending channel on the daily chart 💁♂️
A potential pullback to the $4.2385 support zone suggests a strong opportunity for bullish continuation 📈
Expect upward momentum with targets at $5.81, $6.81, and higher levels as the trend strengthens 🎯

Bullish trend for #SuiUsdtA bullish trend on SUI could occur if the price breaks above **5.1690** (resistance), moving averages (MA7, MA25, MA99) align upward, RSI climbs above **50**, and trading volume increases during price rises. Key support to watch is **5.0442**; staying above it shows buyers' strength.

SUI TRADE IDEA SUI has performed remarkably this Bullrun and it doesn't look to be slowing down. This is just some thoughts on the low timeframe:
Bullish scenario -
A retest of the green zone which is a clear bullish orderblock and the last local high would be an ideal place to get into a Long to then fill the wick up to local high. The general rule of thumb is that wicks get filled and this move would be a near 20% with good R:R. A poor reaction/ no reaction in the green zone would void the trade idea and the Daily support is the next area of interest.
Bearish scenario -
A SFP once the wick gets filled would be a potential bearish trigger with the midpoint and green zone providing areas for the bulls to fight back. SUI is very overbought on the higher timeframes so a larger cool down could be triggered by this pattern playing out. I do also think BTC would have to pullback in order to drag SUI down with it as SUI is just so strong at the moment.
So far a strong start from the US market with the first meaningful day back since the holidays providing strong volume and a bullish bias.

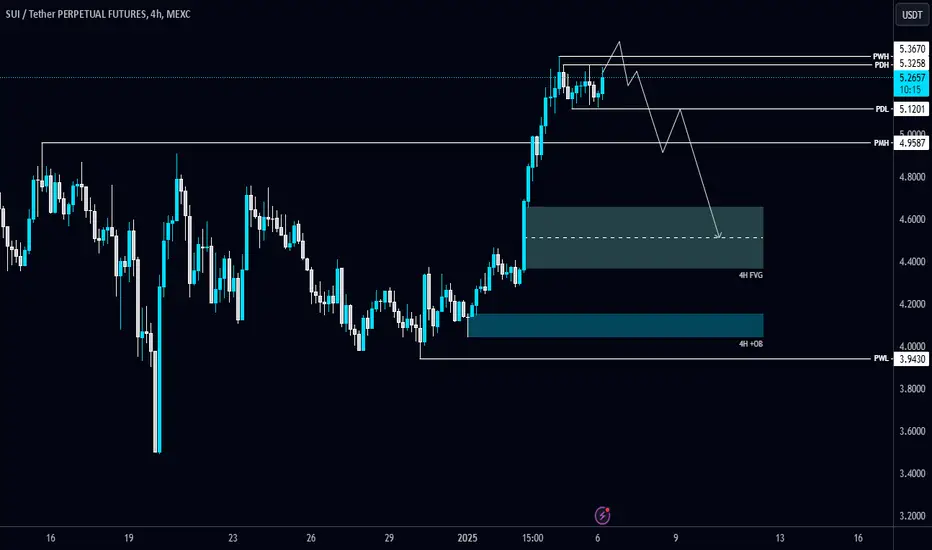
$SUI/USDT AnalysisCRYPTOCAP:SUI is showing strength in the 4-Hour TF!
✅ Look for retracement to long CRYPTOCAP:SUI as there's a 4H FVG and OB below.
⚠️ If Buy-side Liquidity is taken and CRYPTOCAP:SUI closes below, consider shorting.

SUI Outlook H4The form of a Bull Flag pattern, there is rejection in the RSI which indicates many buyers,
there is potential for BMS, if there is a price will head to the first BSL at 39300, and at fibbonaci 1,618 at 43047
if there is a correction and BMS fails to occur the price can fall to entry 1 and 2, if it is still held at entry 2, the bull flag is still confirmed, otherwise the price will fall to the nearest SSL

Sui Bucks the TrendUnlike most coins, Sui continues to constantly trend in an upwards direction. Historically, it hasn't always returned to the best Risk:Reward levels
