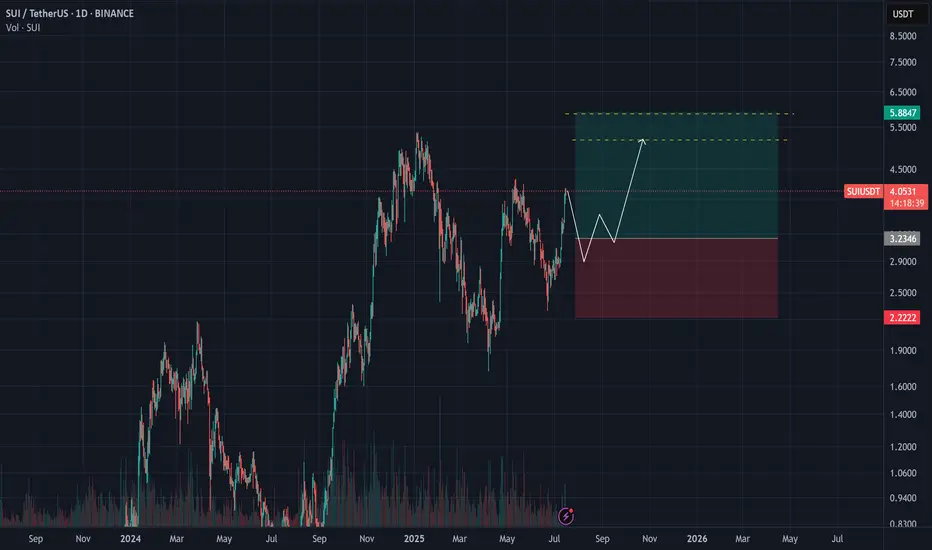
SUI - Daily Chart PerpectiveThis chart is in expansion to our previous post:
What we can see is SUI has clearly broken out of its symmetrical triangle (yellow trendlines). This is the first good sign for potential new highs for SUI.
However since the 4H chart could be spelling out a short term drop lets see where price could go.
Right now it is testing the 0.618 of the macro trend as resistance. It could also be battling with the top range of wick price action (dotted white lines).
If price does fall on the 4H chart it could coincide with a retest of our yellow trendline.
If we get a retest and hold of that yellow trendline that will be the confirmation we need for a full blown breakout for SUI.
If we do not fall on the 4h chart and break back above the $4 level then price will head to the 0.786 ($4.60) followed by a test of the previous high.
SUIUSDT trade ideas

Sui Update · Clearly Moving Towards $7.62, $11.3 & $15The SUIUSDT chart looks great and just today we are witnessing a bullish continuation. Resistance was found 11-July but the market didn't produce any significant retrace. This is obviously because we are ultra-bullish and ultra-bullish can only mean sustained growth.
After the 11-July resistance, one day neutral and now resistance is being challenged again. Based on how Bitcoin is doing, a new all-time high; based on how the market is doing, great; we can expect higher prices in the coming weeks and months.
There will always be swings. Retraces and corrections but the bigger picture is a strong bullish dynamic for months. Think of 4-8 months of prices rising non-stop. That is what you are about to experience. Keeping in mind that the start date is 7-April and not today. So 6-8 months starting early April, growth long-term.
We will have a new all-time high for on this pair. There is huge potential for growth. The target on the chart is an easy one based on the short-term (within 1 month/30 days). After $7.62 we have $11.27 followed by $15. As you can see, it is still early within this bullish wave.
Thanks a lot for your altcoin choice, a great pick.
Your support is appreciated.
Namaste.

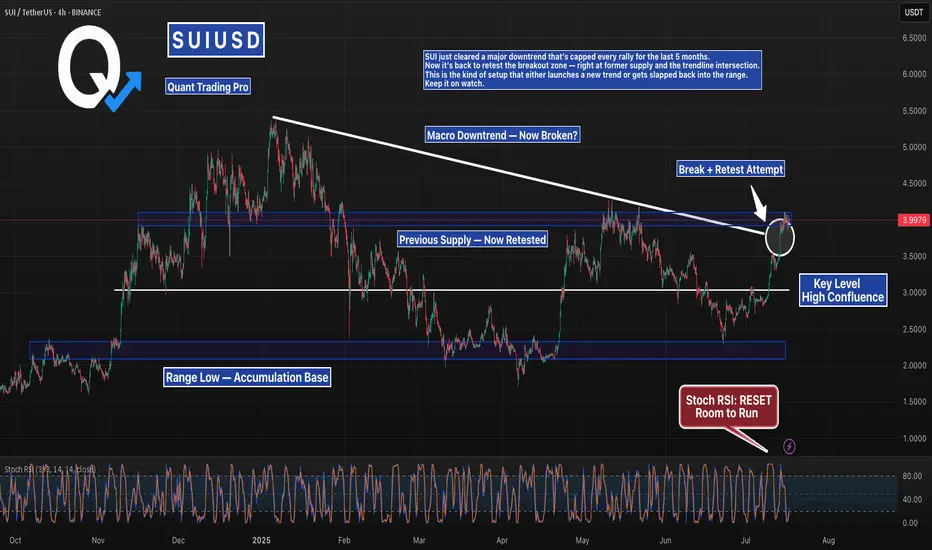
SUI Just Broke Its Downtrend — But Can It Hold?SUI just cleared a major downtrend that’s capped every rally for the last 5 months.
Now it’s back to retest the breakout zone — right at former supply and the trendline intersection.
This is the kind of setup that either launches a new trend or gets slapped back into the range.
Keep it on watch.
#SUI #SUIUSDT #CryptoBreakout #TrendlineTest #ChartAnalysis #BacktestEverything #TradingView #QuantTradingPro #CryptoTraders
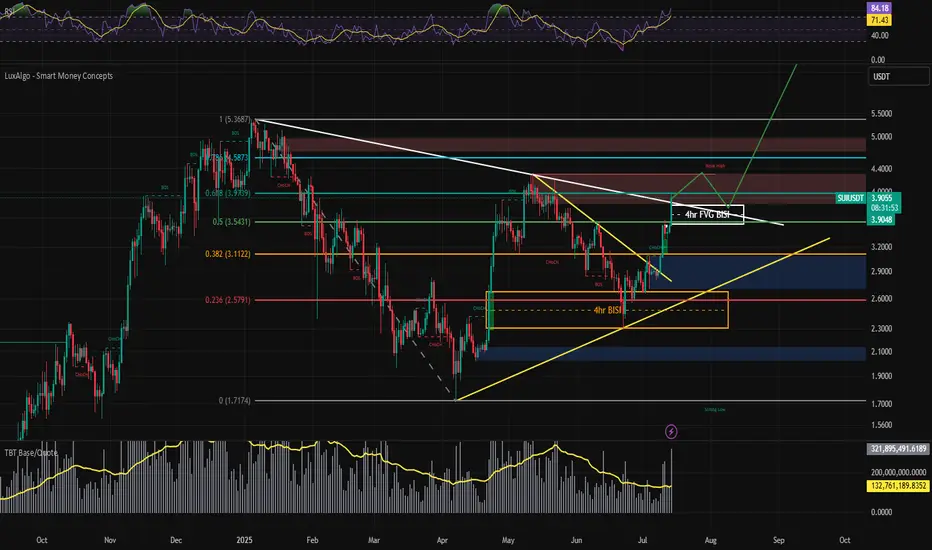
SUIUSDT Long IdeaDescending trendline of lower highs has been breached
Should expect rejection at $4 area and a slight pullback to 0.382 fib level around $3.35
Resistance at $4 area should be closely monitored and if breached, wait for retest and confirmation in order to set up long position.

Will key support be held or broken today?Hello friends
According to the complete analysis we conducted on this currency, we concluded that the price correction can continue with the failure of the specified support and go to lower supports, but if buyers support the price in the support area, it can have a good rise.
Note that with capital and risk management, you can buy in steps in the specified support areas and move with it to the specified targets.
*Trade safely with us*

#SUI/USDT ready to surge 13% toward $3.72 target?#SUI
The price is moving within a descending channel on the 1-hour frame, adhering well to it, and is on its way to breaking it strongly upwards and retesting it.
We have a bounce from the lower boundary of the descending channel. This support is at 3.30.
We have a downtrend on the RSI indicator that is about to be broken and retested, supporting the upside.
There is a major support area in green at 3.20, which represents a strong basis for the upside.
Don't forget a simple thing: ease and capital.
When you reach the first target, save some money and then change your stop-loss order to an entry order.
For inquiries, please leave a comment.
We have a trend to hold above the 100 Moving Average.
Entry price: 3.44
First target: 3.53
Second target: 3.62
Third target: 3.72
Don't forget a simple thing: ease and capital.
When you reach the first target, save some money and then change your stop-loss order to an entry order.
For inquiries, please leave a comment.
Thank you.

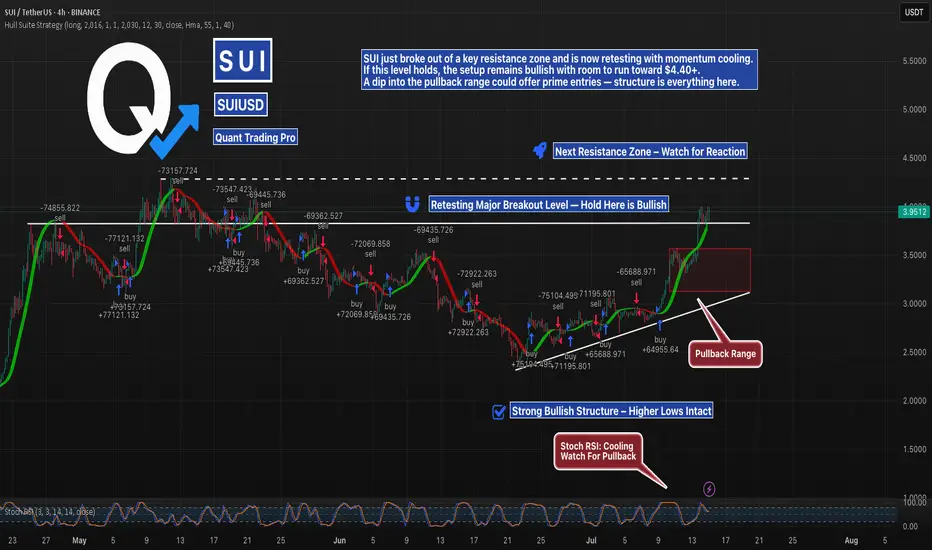
SUI Breakout Retest in Progress — Bulls Have the BallSUI has finally broken above major horizontal resistance and is now retesting that level, backed by a rising trendline of higher lows. With Stoch RSI cooling and the price sitting just above a prior range, this is the key decision zone.
If bulls defend the breakout, continuation toward $4.40+ is likely. If not, the pullback zone between $3.50–$3.00 becomes critical. Structure still favors the bulls — but confirmation is everything.
#SUIUSDT #CryptoBreakout #QuantTradingPro #TradingView #BacktestYourEdge #AltcoinSetup
Sui long to $4.00Just opened a long position on sui. Its not the usual time for a long on the weekend but I got a few confirmations so while it feels weird am taking a risk on it.
Btc recently made ATH and it keeps going. So...expect anything.
See tp targets on chart.
stop: $3.3411 - wide and conservative
DTT strategy applied
Direction, Target and Timing

$SUI breakout incoming?Looks like SUI is having strength IMO. I wonder if the breakout confirms and holds :O

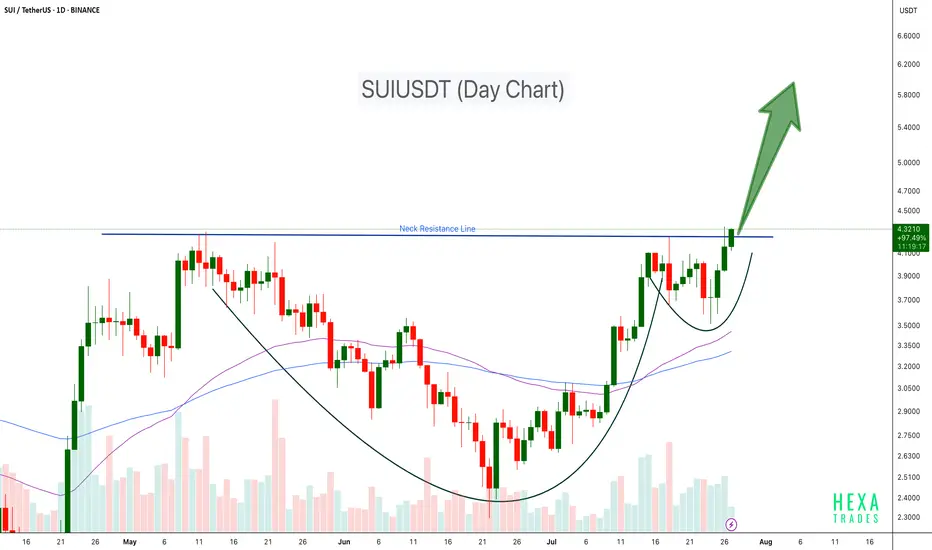
SUIUSDT Cup & Handle Breakout SUI has formed a classic Cup and Handle pattern on the daily chart and has now successfully broken above the neckline resistance around $4.30. This breakout could trigger a strong bullish continuation if volume sustains and retests hold.
Key Points:
Pattern: Cup and Handle
Breakout Level: ~$4.30 (neck resistance)
Potential Upside Target: $5.50 – $6.00+ based on pattern projection
Support Zone: $3.50
Confirmation: Sustained volume and close above neckline
Cheers
Hexa
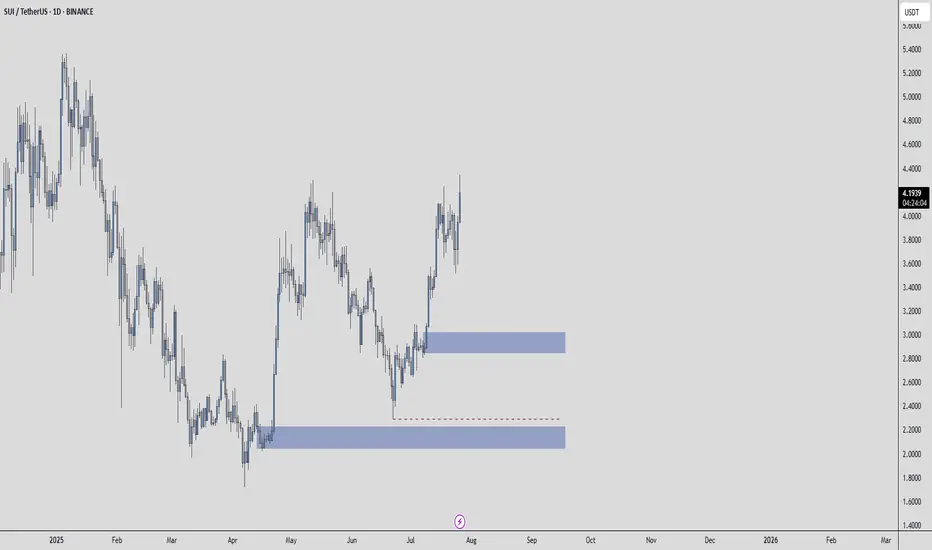
SUIUSDT – A Setup Worth WatchingThe blue box isn't just a zone, it’s a place where value and timing intersect.
🟦 Context
If price enters this area with control:
It aligns with past volume cluster support
A clean 1H break and confirmation may unlock high R:R potential
Structure + patience = confidence
📌 Execution Plan
🧭 No need to predict.
Just observe:
✅ Does the blue box hold with absorption or slowdown?
✅ Does CDV remain constructive?
✅ Does the 1H chart break and confirm direction?
If yes, there’s asymmetry on your side.
And that’s when smart trades happen.
"It’s not about being early. It’s about being right when it matters."
— And that starts with a prepared eye and a defined plan.
📌I keep my charts clean and simple because I believe clarity leads to better decisions.
📌My approach is built on years of experience and a solid track record. I don’t claim to know it all but I’m confident in my ability to spot high-probability setups.
📌If you would like to learn how to use the heatmap, cumulative volume delta and volume footprint techniques that I use below to determine very accurate demand regions, you can send me a private message. I help anyone who wants it completely free of charge.
🔑I have a long list of my proven technique below:
🎯 ZENUSDT.P: Patience & Profitability | %230 Reaction from the Sniper Entry
🐶 DOGEUSDT.P: Next Move
🎨 RENDERUSDT.P: Opportunity of the Month
💎 ETHUSDT.P: Where to Retrace
🟢 BNBUSDT.P: Potential Surge
📊 BTC Dominance: Reaction Zone
🌊 WAVESUSDT.P: Demand Zone Potential
🟣 UNIUSDT.P: Long-Term Trade
🔵 XRPUSDT.P: Entry Zones
🔗 LINKUSDT.P: Follow The River
📈 BTCUSDT.P: Two Key Demand Zones
🟩 POLUSDT: Bullish Momentum
🌟 PENDLEUSDT.P: Where Opportunity Meets Precision
🔥 BTCUSDT.P: Liquidation of Highly Leveraged Longs
🌊 SOLUSDT.P: SOL's Dip - Your Opportunity
🐸 1000PEPEUSDT.P: Prime Bounce Zone Unlocked
🚀 ETHUSDT.P: Set to Explode - Don't Miss This Game Changer
🤖 IQUSDT: Smart Plan
⚡️ PONDUSDT: A Trade Not Taken Is Better Than a Losing One
💼 STMXUSDT: 2 Buying Areas
🐢 TURBOUSDT: Buy Zones and Buyer Presence
🌍 ICPUSDT.P: Massive Upside Potential | Check the Trade Update For Seeing Results
🟠 IDEXUSDT: Spot Buy Area | %26 Profit if You Trade with MSB
📌 USUALUSDT: Buyers Are Active + %70 Profit in Total
🌟 FORTHUSDT: Sniper Entry +%26 Reaction
🐳 QKCUSDT: Sniper Entry +%57 Reaction
📊 BTC.D: Retest of Key Area Highly Likely
📊 XNOUSDT %80 Reaction with a Simple Blue Box!
📊 BELUSDT Amazing %120 Reaction!
📊 Simple Red Box, Extraordinary Results
📊 TIAUSDT | Still No Buyers—Maintaining a Bearish Outlook
📊 OGNUSDT | One of Today’s Highest Volume Gainers – +32.44%
📊 TRXUSDT - I Do My Thing Again
📊 FLOKIUSDT - +%100 From Blue Box!
📊 SFP/USDT - Perfect Entry %80 Profit!
📊 AAVEUSDT - WE DID IT AGAIN!
I stopped adding to the list because it's kinda tiring to add 5-10 charts in every move but you can check my profile and see that it goes on..
SUI / USDT : Looking bullish SUI/USDT chart shows a breakout from a descending trendline, confirming upward momentum. Current price tests the resistance zone around $4.00. BTC is receiving support from the FVG, indicating short-term bullish potential.
Bullish Scenario: If price breaks above the resistance zone, a rally towards $4.50 to $5.00 is possible. Watch for confirmation of higher highs on shorter timeframes.
Invalid Setup: If price fails to break the resistance and falls back below $3.50, the bullish setup would be invalidated.
Pro Tip: Always wait for a clear confirmation candle above the resistance zone before entering a trade to minimize risk.


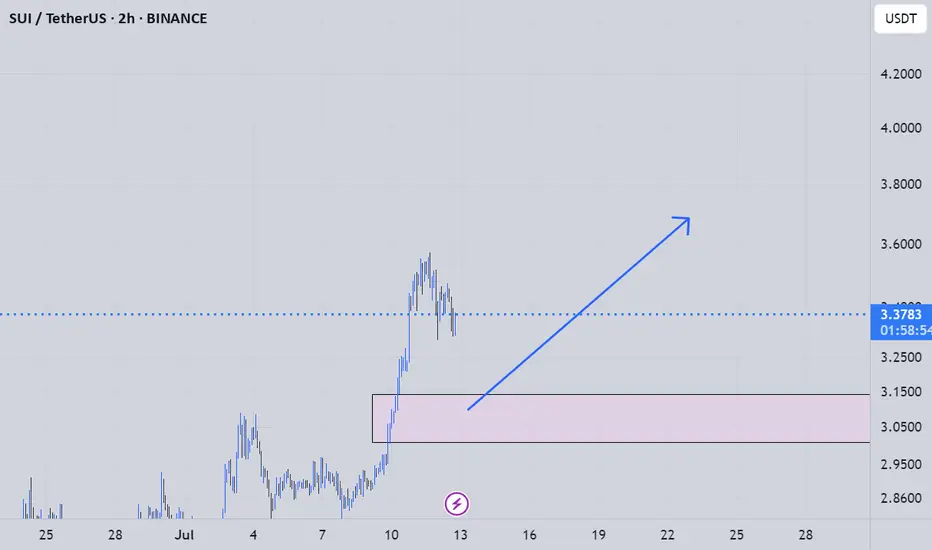
SUIUSD @ Retest Zone | Breakout Setup?SUI is consolidating in a potential bull flag above the previous resistance zone around $4.00.
Stoch RSI is low, trendline support is still intact, and a clean R:R setup presents itself with TP at $4.40 and SL at $3.80.
Watching for volume breakout confirmation before entry.
#SUIUSD #BullFlag #Crypto #SupportResistance #BreakoutSetup #TradingView #QuantTradingPro

SUI Analysis – July 15, 2025
SUI appears to have entered its bullish phase slightly earlier than most other altcoins.
This move seems to be fueled by a number of key partnerships and contracts signed over the past six months — a fundamentally positive signal.
📊 However, based on the current chart structure,
entering at this level may not be the most attractive opportunity.
✅ While a short-term 20% upside could be possible,
it’s more prudent to wait for price to test its previous high,
and observe how investors react to that resistance zone.
Their behavior will offer clearer insight into whether a continuation or correction is likely.
SUI Daily break outSui has been trading in a triangle pattern facing overhead resistance since Jan 5 highs, pierced resistance today, expecting to retest of the FVG created then bounce to create new ATHs
suiusdt long analysyou can use this analys for your spot trades its a longsetup for making a good profit and a getting on a big trend
Is SUI ready to surge 13% toward $3.95 target?Hello✌
let’s dive into a full analysis of the upcoming price potential for SUI 📈.
BINANCE:SUIUSDT has broken out of its descending channel with notable volume, indicating a potential shift in momentum. Price action is currently holding near a key support area, which could act as a solid base for further upside. With sustained buying pressure, a move toward the $3.95 target offering at least 13% upside remains on the table. 📈🔥
✨ Need a little love!
We pour love into every post your support keeps us inspired! 💛 Don’t be shy, we’d love to hear from you on comments. Big thanks , Mad Whale 🐋


DeGRAM | SUIUSD got out of the channel📊 Technical Analysis
● Price pierced the four-week falling-channel roof and the apex of a contracting triangle, turning 2.88 support into a launchpad and carving a sequence of higher lows.
● Breakout measured move and channel mid-band converge at 3.15; a close above there exposes the next horizontal barrier and channel top at 3.46. Risk is framed by the former triangle base at 2.88 and major swing floor 2.69.
💡 Fundamental Analysis
● Sui’s on-chain TVL has climbed >15 % since 25 Jun after zkLogin main-net rollout and Mysten Labs’ new developer grants, underpinning demand despite broad market lethargy.
✨ Summary
Long 2.90-3.05; hold above 3.15 targets 3.46. Invalidate on a 4 h close below 2.88.
-------------------
Share your opinion in the comments and support the idea with a like. Thanks for your support!

SUI - SUI SUI in your ears!Hellooo so SUII moves are marked till the blue line - as stated but beyond it if it goes just in case, you know the path

Trade Update – SUI/USDT✅ Trade Update – SUI/USDT
📅 July 11, 2025
🚀 Target almost fully hit on the 4H breakout move!
🔓 I’ve booked my profits here — solid R:R and clean breakout follow-through.
📉 Broke out of the downtrend
🔁 Retested previous resistance as support
📈 Strong bullish momentum took it straight to target
💰 Hope you’re in profit too if you followed this!
📌 Always manage your risk & lock in gains 🔐
📊 Chart speaks for itself 👇
Follow for more updates 🧠💸
#Crypto #SUI #Bitget #TradeUpdate #Breakout #TA
👉 Follow me on X for more sharp trades 🧠📈
@Ali15349323

sui new long to $3.67Just now opened up a new long position on sui.
Stop: $3.3673
Roughly 2RR.
Market might wick down a bit again but soon I anticipate a new high based on my DTT analysis
