2.4 RR tradeIf price happens to retrace to the indicated range, it should be able to target the given target!
SUIUSDT trade ideas

Above 360% with SUI strategyNo predictions, no telling the future, just automation with strategy. SUI has been volatile in 2024, alternating between downward corrections and growth. Taken together, how much profit do you make from SUI? Backtesting results for this strategy for SUI came in at 367% (commission included) as of January 1, 2024. Quite interesting! Strategy S1-TM is available to check.

SUIUSDT Elliott Waves Analysis (Investment idea)Hello friends.
Please support my work by clicking the LIKE button👍(If you liked). Also i will appreciate for ur activity.
Everything on the chart.
Entry: market and lower
Targets: 2.5 - 5 - 7.5 - 10
Optimistic target: 15 - 20$
after first target reached move ur stop to breakeven
Stop: (depending of ur risk).
ALWAYS follow ur RM
risk is justified
It's not financial advice.
DYOR!

SUI breaking out of triangle to new ATHSUI breaking out of triangle to new ATH. This might be the last chance to get SUI below $4 on this bull run.

Potential SHORT: SUI1. Divergence on Stoch RSI and price Action indicate strong reversal
2. Tweezer top candles are showing strong bearish.
Strong pull back is coming.

SEI vs SUIIf you missed SUI, I’d recommend looking into SEI.
I’ve shown on my chart how similar these two coins are:
•Same technical structure
•Same HH-HL bull pattern
•Breakout of a key level
•Same double top pattern
So, a huge pump is coming!

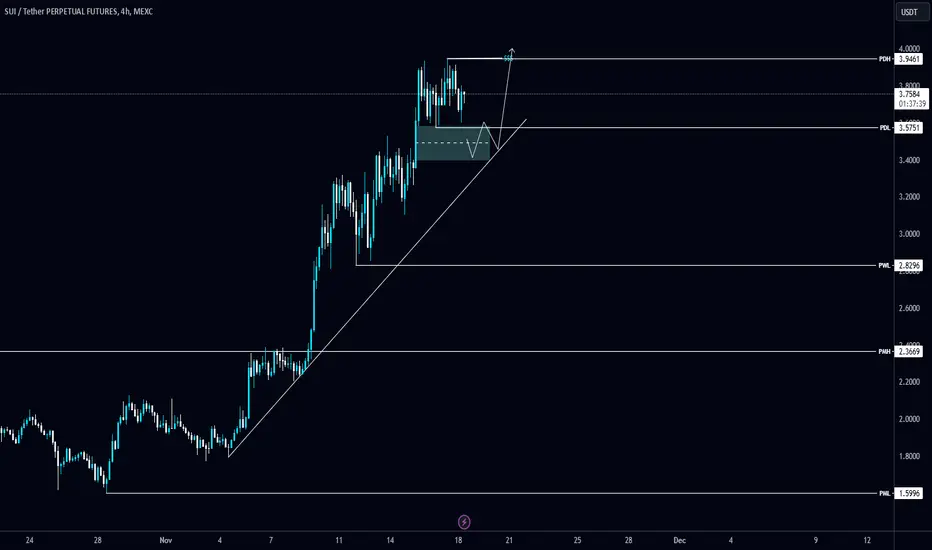
Eyes on this #SUI/USDT 4H FVG to long.Eyes on this #SUI/USDT 4H FVG to long.
Wait for a reaction after tapping 4H FVG. CRYPTOCAP:SUI local support level is PWL $3.8296 and the resistance level is PDH $3.9461.
Will SUI Bounce Back? Key Indicators Suggest Potential ReversalBINANCE:SUIUSDT is currently navigating a critical phase, as highlighted in the latest 1-hour chart analysis. The market is in consolidation, with key support and resistance levels indicating potential price movements.
Recent price action shows a gradual decline from the $3.7722 resistance level, with significant zones at $3.8491 and $3.8763 acting as potential profit targets for bullish traders. Conversely, immediate support is at $3.6342, with lower levels at $3.2894 and $3.2621 presenting downside risks.
Technical indicators reveal a bearish trend, with the 9 EMA consistently below the 20 EMA and a growing negative divergence in the MACD histogram. However, the RSI suggests the asset is nearing oversold conditions, which could lead to a temporary reversal.
Traders should consider a breakout above $3.7722 for long positions, while a breakdown below $3.6342 may signal short opportunities. Vigilance and strategic stop-losses are essential in this volatile environment.

SUI goes for a correctionBINANCE:SUIUSDT
The currency goes for a correction in a falling price channel, then breaks this channel and continues to rise 🚀

$BINANCE:SUIUSDT is Skyrocket to $5-$10 in 2025BINANCE:SUIUSDT is Skyrocket to $5-$10 in 2025
SUI Price Prediction: Recovering Losses Currently, SUl is trading at $1.92, below the $2.03 resistance level. For SUI to make any headway toward reaching its previous ATH of $2.36, it must first flip $2.03 into a solid support level. Doing Would signal renewed bullish interest and could attract further buying momentum. If SUI fails to break through the $2.03 barrier, the altcoin wil likely continue consolidating above its $1.69 support. Prolonged consolidation could contribute to market uncertainty as traders remain hesitant to commit fully to SUI. This lack of a clear trend keeps the price in a holding pattern, delaying any significant moves towarda new ATH.
The bearish-neutral outlook for SUl will be invalidated if it manages to turn $2.03 into support while broader market conditions turn bullish. Such a shift would boost confidence in SUl's trajectory, potentially reigniting its rally ambitions and setting the stage for a new all-time high.

UPDATEThe long-term analysis of the previous post is still valid and the price has entered the second channel/by maintaining the support of 3.50 and breaking the short-term resistance of 3.96, the price will continue its upward movement/the distance between these numbers(3.50 & 3.96) is the space of indecision and suffering

Full retest on the previous main zone on #SUI. #SUI is the new winning stallion on the track. It would be silly to deny it. My chart is my chart. It's not for everyone. I have faith in it and you should have faith in your own charts on #SUI.

SUI: A Bullish Setup with a Potential Pullback?In recent months, SUI has garnered significant attention within the crypto community, driven by its innovative blockchain technology and bullish market momentum. As of today, SUI is trading at $1.95, while external liquidity sits at $2.16 USD. This creates an intriguing scenario for traders and investors looking to capitalize on both short-term and long-term movements.
The Case for a Price Sweep to $2.16
From a technical perspective, SUI’s current price action hints at a potential sweep above the external liquidity level of $2.16. Whales, who typically control large portions of the market, could be planning a move to drive the price above this previous high. Such a breakout would likely attract FOMO (fear of missing out) buying, pulling in retail traders and boosting the price further. This is a classic strategy used by smart money to attract liquidity before reversing the trend.
Overbought Conditions and Potential Pullback to $1.00
Despite the bullish momentum, indicators such as the Volume Profile suggest that SUI may be overbought at these levels. While the market sentiment remains positive, this creates the ideal conditions for a strategic dump by larger players. After sweeping liquidity at $2.16, a strong pullback to $1.00 is plausible. This retracement would bring the asset back into a discounted price range, offering a more appealing entry point for both retail and institutional investors.
What to Expect
In the near term, keep an eye on the $2.16 level as it may act as a psychological resistance point. Once this sweep occurs, the market could see a sharp drop to $1.00, providing opportunities for patient investors to re-enter the market at a more favorable price.
While the overall outlook for SUI remains bullish, this potential correction could offer a much-needed reset before the next major rally.
Stay tuned and be ready for swift market movements as SUI continues to be a hot asset in the crypto space.
Lord MEDZ
The information provided in this blog is for educational and informational purposes only on behalf of Lord MEDZ and should not be considered financial advice. Cryptocurrency investments are highly speculative and involve significant risk, including the potential loss of your entire investment. Always conduct your own research and consult with a qualified financial advisor before making any investment decisions. Lord MEDZ do not hold any responsibility for the accuracy, completeness, or validity of the information provided, nor any liability for any losses incurred from any investment or trading activity undertaken based on this content.

Sui one of my 2025 altcoin picksSui has decoupled from the regular crypto market and BTC. It is important to look at BTC pairs when evaluating what may or may not pump for alt season. While I may be entering on a huge pump and into highs, if you plan on holding for a few months to a year plus 15-20% moves mean nothing. I am starting my position now as I have identified this token as a mover against BTC and a high momentum, hyped token. If we somehow get into the marked golden pocket (rectangle) I will add heavy there. Otherwise a couple hundred a week it is.

3.4 risk reward long suisui is in clear uptrend and chances of this playing is high so lets long this ....of course no final advice lets see

SUI/SOL Trendline Breakout with 257% Upside PotentialAfter months of trading within a downtrend, SUI/SOL has broken out above its descending trendline, indicating a potential reversal in trend. Here's a closer look:
1️⃣ Trendline Breakout:
The downtrend that began in mid-2023 has now been invalidated by a decisive breakout above the resistance trendline.
This breakout is backed by strong price momentum and increasing volume, suggesting growing buyer interest.
2️⃣ Measured Move Target:
By measuring the previous swing range, the upside potential targets a move of 257%, as shown in the projection box on the chart.
The price could potentially rise to the 0.06 zone, aligning with historical price resistance levels.
3️⃣ Key Resistance Levels:
Immediate Resistance: 0.019 (breakout retest area).
Major Target Zone: 0.061.
Trade Plan:
✅ Entry: Look for a retest of the breakout zone around 0.017 - 0.019 for confirmation.
✅ Stop-Loss: Place stops below the descending trendline 0.015
✅ Take Profit: Gradually scale out at 0.045 and 0.06.
Macro Context 🌏
With positive sentiment building across the crypto markets, SUI could see significant upside compared to other layer 1s like SOL, particularly if it sustains above the breakout zone.

#SUI/USDT / Ready to go up#SUI
The price is moving in a descending channel on a 15-minute frame and sticking to it well
We have a bounce from the lower limit of the descending channel, this support is at a price of 2.20
We have a downtrend, the RSI indicator is about to break, which supports the rise
We have a trend to stabilize above the moving average 100
Entry price 2.27
First target 2.32
Second target 2.37
Third target 1.45

SUIUSDTmy entry on this trade idea is taken from a point of interest BELOW an inducement.. I extended my stoploss area to cover for the whole swing as price can target the liquidity there before going as i anticipate.. just a trade idea, not financial advise

suioi oi
we rich!
we rich!
we rich!
I am Batman...
tradingview not letting me post until I write more description...phew!!!

Sui chartSui chart.
These are the key levels for Sui with the current price action. Each line can reject to a new low.
If the price is bullish will hold Target1 as support and go for Target2.
For those interested I teach a course about charting.

TIME TO SELL SUIMarketmaker is allocating its assets and getting ready to pump up Aptos! Time to dump this shitcoin.

SUI will continue its flight The issue is concentrated in single hands, the chart is technically as bullish as possible, and there has been no distribution yet! My target: 4$. See you at that mark!
Horban Brothers!

SUIUSDTmy entry on this trade idea is taken from a point of interest BELOW an inducement.. I extended my stoploss area to cover for the whole swing as price can target the liquidity there before going as i anticipate.. just a trade idea, not financial advise
