#SUI #SUIUSD #SUIUSDT #Analysis #Eddy#SUI #SUIUSD #SUIUSDT #Analysis #Eddy
As the chart shows, the coin has a choch & an intact, high-potential daily order block inside weekly order block that needs to be mitigation.
I have identified the important supply and demand zones of the higher timeframe for you.
This analysis is based on a combination of different styles, including the volume style with the ict style.
Based on your strategy and style, get the necessary confirmations for this analysis to enter the trade.
Don't forget about risk and capital management.
The responsibility for the transaction is yours and I have no responsibility for your failure to comply with your risk and capital management.
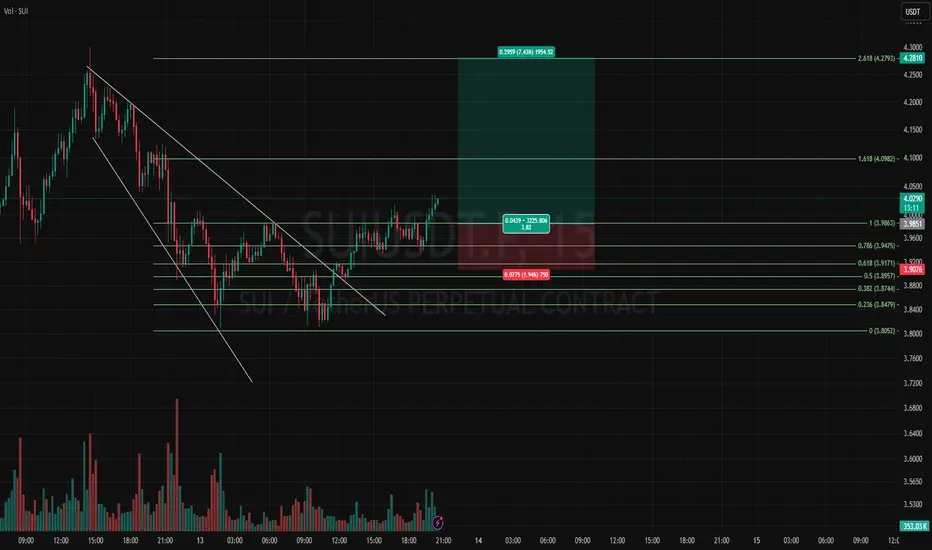
💬 Note: Important liquidity is marked on the chart. Be careful of liquidity hunting. In my opinion, the important entry point for buying spot and long futures is at 2.1693$, and it will most likely be a sniper entry. The first target from the specified point will be $5.5 and the second target will be $8.
Be successful and profitable.
SUIUSDT trade ideas

SUI Structure Complete – Time for Pain or Profit?Yello Paradisers, have you noticed how calm #SUIUSDT has been lately? Feels like nothing’s happening... but that's exactly how the market sets the trap before it strikes. The recent price action has lulled many into a false sense of comfort, trading tightly in a sideways structure after a strong impulsive leg. But behind that calm surface, a bigger move is loading — and only those who can read the structure properly will be prepared for it.
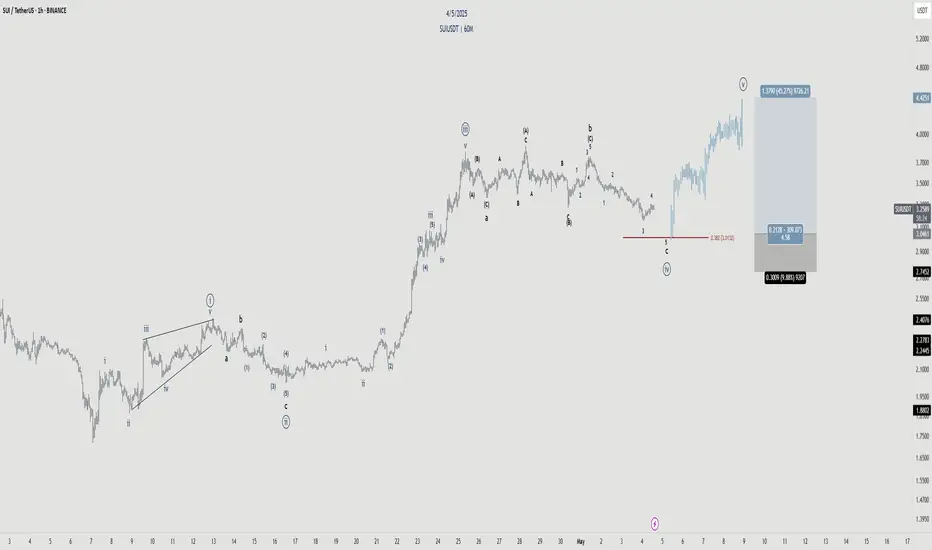
💎#SUI has now completed its 5-wave Elliott impulse, finishing with a classic Ending Diagonal in the fifth wave, which very often signals the final push before a correction. Given the current price action, we are likely in the early formation of an ABC corrective structure, most probably a Zigzag or Flat formation. This transition is crucial — many traders misinterpret this as the start of a new trend and get trapped. But as professionals, we know that this is not the time to rush into positions. This early corrective phase often includes fakeouts and liquidity grabs, punishing both longs and shorts before clarity returns.
💎SUI has been trading with high volatility compression, coming off a significant bullish breakout that began around early April. The rally initiated with a textbook Leading Diagonal, moved into a sharp Wave 3 impulsive expansion, and finally started to slow down into what looked like exhaustion through Wave 5. During this phase, price carved out a Contracting Triangle (Falling Wedge), providing a resting phase before the final fifth wave. But right after the Ending Diagonal was completed, momentum has stalled, and now we're entering a very tricky part of the market cycle — the corrective phase.
💎Zooming out, the entire structure has unfolded in a methodically clean and technically sound manner. Wave 1 kicked off the move with a Leading Diagonal, signaling the early stages of bullish initiation. This was followed by a shallow Wave 2 retracement, which is typical of fast, trending markets. Wave 3 then expanded with strong bullish momentum, confirming the impulse. After that, Wave 4 transitioned into a Contracting Triangle (Falling Wedge) — a classic consolidation pause before the final push. Finally, Wave 5 wrapped up the sequence with an Ending Diagonal, a clear sign of momentum exhaustion. This full five-wave development marks a textbook impulsive structure, and strongly suggests that we are now entering a critical transition phase, where the market moves from trending into correction. These are often the most deceptive parts of the cycle — known for shakeouts, liquidity traps, and emotional whiplash for those who act too soon.
💎Looking ahead, the next probable strong move depends on how price reacts around the key S/R level at $3.006. If this zone holds and the correction stays controlled above it, we can prepare for a powerful continuation leg back toward the $4.20 resistance, and potentially challenge the major resistance at $4.80–$5.00. However, if the correction unfolds deeper, a full retest of the $2.40–$2.00 range is absolutely on the table. This zone aligns with macro demand levels and could act as a reload zone for the next major impulse. But only once the correction completes.
💎One of the main hurdles SUI now faces is breaking cleanly above $4.20 — this is the near-term barrier where supply pressure remains strong. Beyond that, $4.75–$5.00 is a macro resistance zone that needs significant volume and structure to crack. Until then, any sharp move upward could just be part of a larger fakeout inside the corrective pattern.
💎On the downside, our key invalidation level sits just below $3.00. A 12H candle close below $3.006 would confirm that the support zone is lost and shift our bias into a much deeper retracement phase. This would invalidate any early bullish setups and bring the $2.40–$2.00 zone in play, with liquidity likely waiting beneath that structure.
This is the point where the weak hands get shaken out and smart money reloads. If you're aiming for long-term success, wait for high-probability setups and protect your capital. Strive for consistency, not quick profits. Treat the market as a businessman, not as a gambler.
MyCryptoParadise
iFeel the success🌴

SUI Battles Key Technical Resistance Around $4 Will Bulls Break?SUI is trading at a major resistance zone near $4, showing signs of potential rejection at a multi-confluence level. A failure to break above may trigger a pullback to $2.70.
SUI is currently testing a significant technical resistance area around the $4 mark. This region aligns with multiple confluences: the 0.618 Fibonacci retracement, a newly formed daily support/resistance (SR) level, an internal daily SR, and a key monthly SR level. These overlapping indicators make it a powerful resistance zone and explain the recent hesitation in bullish momentum.
Price has begun to stall at this zone, suggesting that sellers are stepping in. If SUI confirms a rejection at this level with lower closes in the coming sessions, a move toward lower support levels becomes likely. The $2.70 mark stands out as the next high-probability demand zone—it captures internal daily SR and would act as a healthy higher low in the macro structure.
Despite the potential pullback, a correction to $2.70 would be seen as bullish selling, offering a possible re-entry point for a longer-term upside move. Until then, all eyes remain on whether SUI can push through $4 with conviction or rotate lower to reset momentum.

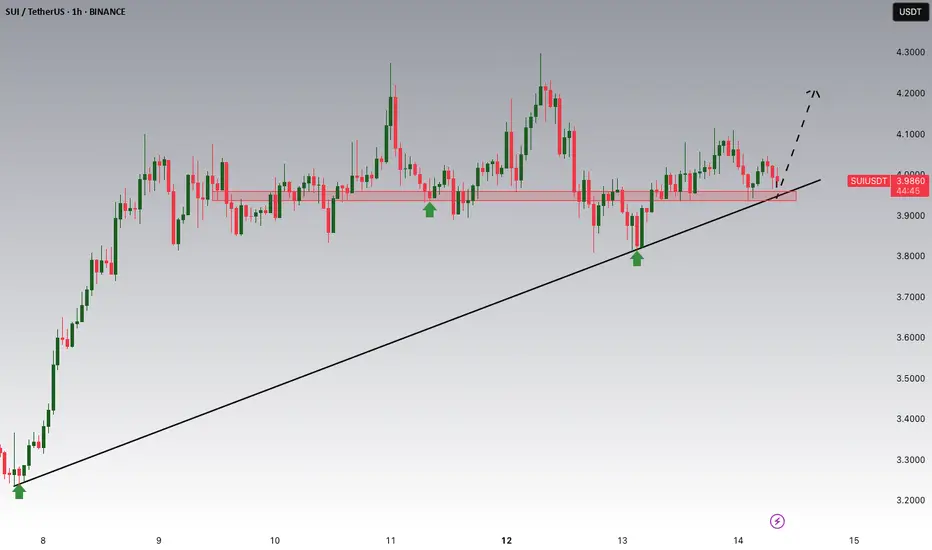
SUI Looks Ready for the Next Leg Up | Bullish Structure IntactClean structure, clean bounce 💪
SUI holding trendline + previous support zone
Breakout from triangle = next wave incoming? 🚀
Let’s see how it plays out!
#SUI #CryptoAnalysis #TechnicalAnalysis

SUI Technical Breakdown – Inverse Head & Shoulders in Action!
On the daily timeframe, SUI is currently retesting the neckline of a confirmed Inverse Head & Shoulders pattern — a classic bullish reversal setup.
📈 If this pattern plays out fully, CRYPTOCAP:SUI could revisit all-time highs and enter price discovery mode soon! 🌌
Target : 5.6$

SUI/USDT Daily Chart Analysis – Rising Wedge Breakdown & Demand SUI/USDT Daily Chart Analysis – Rising Wedge Breakdown & Demand Retest in Sight
The daily chart of SUI/USDT shows a clear rising wedge pattern, typically a bearish continuation formation, which now appears to be breaking down. Price has recently been rejected from a major supply zone between $4.15 – $4.40, where historical resistance caused a reversal.
The break below the lower trendline of the wedge suggests that bullish momentum is weakening. Volume also shows a notable decline during the wedge formation and a spike on the breakdown, adding confirmation to the bearish signal.
Currently, price is approaching the first key demand zone around $3.55 – $3.70, which is also the previous breakout level and may act as initial support. A clean retest and strong reaction here could offer a short-term bounce.
Below that, a stronger “LONG IDEA” demand zone sits between $3.20 – $3.40, marked by previous consolidation and structural resistance turned support. This area represents a potential long entry zone for swing traders seeking a better risk/reward setup.
The lower green zone, labeled “SUPPORT” around $2.70 – $3.00, serves as a deeper fallback level in case of continued selling pressure.

SUI/USDT: Key Support Test Within Ascending ChannelThe SUI/USDT market recently retested the $4.00 resistance after an extended period of ranging and has since slipped toward the lower boundary of its ascending channel. The price is now approaching the $3.50 support zone, a critical area that may spark a bullish rebound and continuation of the current structure.
The trend remains defined by higher lows, with price action contained within the upward-sloping channel. A strong reaction near the blue trendline support could pave the way for a move toward the $4.50 resistance

SUI CONSOLIDATION - When Breakout?CRYPTOCAP:SUI has been seen to range within the box on the 1hr timeframe chart since 8th May and it’s still within the box. What do you expect - upward or downward breakout?
Please support this idea with a LIKE👍 if you find it useful🥳
Happy Trading💰🥳🤗

Lingrid | SUIUSDT potenatil PULBACK Trade from SUPPORTThe price perfectly fulfills my last idea . BINANCE:SUIUSDT retested the $4.00 top after an extended range and has now slipped toward the lower edge of its ascending channel. Price is eyeing the $3.50 support zone for a possible bounce to resume bullish structure. The reaction near the blue trendline will be key to unlocking upside toward $4.50.
📌 Key Levels
Support level: 3.5000
Resistance: 4.0000 and 4.5000
Trend structure: Higher lows inside an ascending channel
⚠️ Risks
Failure to hold $3.50 could trigger a deeper pullback
Rejection at the $4.00 mark again would signal waning momentum
Breakdown below the upward trendline would invalidate the current bullish bias
Traders, if you liked this idea or if you have your own opinion about it, write in the comments. I will be glad 👩💻

W back Test impulsive move to ATH on SUI W back Test, should break out impulsive into ATH resistance around 9 - 14 looking $12 pull back retracement to $5 - $4.40 likely after.
W pattern back test look at RSI for room, this is a 3 DAY CHART
CRYPTOCAP:SUI

SUI - Incoming wave 5Wave structure is very defined.
Currently looking for the completion of this corrective sequence of Wave 4 before we bounce at the key level 38.2%.
Targeting the high.
SUI in a possilbe "Complex Wyckoff Reaccumulation" We could be in a complex reaccumulation bouncing around between $3.85 and $4.08, as a temporary situtation before a longer elliote wave 5 up to the $4.50 range.
Market makers might be testing out both sides of the range to shake out weak hands.
Multiple Fakeouts or Upward Thrusts (UT) are happenign with all the over-eager buyers; these false breakouts trap breakout traders.
We are seeing Multiple Spring s: where price dips below support to stop folks out before reversing.

We will be selling SUIUSDTPrice broke structure to the downside..
We are waiting for that liq sweep near the Bearish Order block.
Fine tuning (zoom down) to 15min time frame we clearly see our OB not mitigated.
Thus we short from the position

Be careful with SUI !!!The SUI will increase 50 cents and reach to the top of the wedge in the coming days .
Give me some energy !!
✨We spend hours finding potential opportunities and writing useful ideas, we would be happy if you support us.
Best regards CobraVanguard.💚
_ _ _ _ __ _ _ _ _ _ _ _ _ _ _ _ _ _ _ _ _ _ _ _ _ _ _ _ _ _ _ _
✅Thank you, and for more ideas, hit ❤️Like❤️ and 🌟Follow🌟!
⚠️Things can change...
The markets are always changing and even with all these signals, the market changes tend to be strong and fast!!

SUIUSDT: Is the upcoming resistance likely to break on the 1H ??🔍✨ SUI Analysis – 1H Timeframe
SUI has experienced two fake breakdowns on the 1-hour chart ⚠️📉 but has successfully held its key support zone 🛡️🔒.
If the price manages to break above the 4.0814 resistance 💥📊, it could open the door for a potential long position 🚀📈 — especially since the daily trend remains bullish 🌞📅📈.
⚠️ This is just a personal view 👀 — not financial advice!
If you decide to enter, make sure to apply proper risk management 🧠📏 and capital control 💼💰✅.
#SUI #Crypto #1HChart #Breakout #Bullish #LongSetup #TradingTips #RiskManagement #DYOR 🔍📊

SUIUSDT → False breakdown of support before growthBINANCE:SUIUSDT has entered a consolidation phase within a bullish trend. The chart shows a zone of interest and a trigger area that are worth paying attention to...
The coin looks quite positive. An upward trend is forming, which is also supported by the growth of Bitcoin and a relatively positive fundamental background.
Technically, SUI is consolidating between 4.110 and 3.811. Below the support level, a huge liquidity pool has formed, which has not yet been tested. There is a high probability of a false breakdown before the growth continues, but if the market turns out to be more aggressive, buyers may not let the price fall to 3.811, in which case we can consider a breakout of the resistance at 4.11-4.275 and consolidation of the price above these levels with the aim of continuing growth.
Support levels: 3.811, 3.667
Resistance levels: 4.11, 4.275
The movement of Bitcoin shows that the market is gathering liquidity as part of a local correction against the backdrop of a bullish trend. Yesterday, we all witnessed a local liquidation, but there are no reasons for a decline yet. SUI, in an ideal scenario, may test support at 3.811 and form a false breakdown before continuing to grow.
Best regards, R. Linda!

SUI/USDT Potential UpsidesHey Traders, in today's trading session we are monitoring SUI/USDT for a buying opportunity around 3.94 zone, SUI/USDT is trading in an uptrend and currently is in a correction phase in which it is approaching the trend at 3.94 support and resistance area.
Trade safe, Joe.
SUIUSDT; Heikin Ashi trade ideaBYBIT:SUIUSDT
Simple explanation on the chart. For any additional info's, you can let me know in the comments.
Thank you

SUI Set for a 30% Move? Key Trade Setup InsideSUI/USDT is displaying a strong bullish recovery pattern on the daily chart. The pair has formed a textbook V-shaped reversal, bouncing sharply from the Support Level 2 at $1.7169. The trend has shifted from bearish to bullish, supported by the Auto Trend Line indicator which confirms the uptrend.
🔵 Bullish Structure Highlights
• Price has broken above the intermediate Support Level at $3.1691, converting it into a potential support zone.
• Current price action is hovering around $4.01, with bullish momentum aiming toward the ATH Resistance at $5.38.
• The sharp upward leg is part of a clear V-shaped recovery, suggesting a continuation toward previous highs.
🟢 Trade Setup (Bullish Swing Trade)
Trade Element Level (USD)
Entry Zone $3.73 – $4.01
Stop Loss $3.71
Take Profit $5.38
Risk:Reward ~4.6 R:R (approx.)
📌 Rationale
• The price is approaching a key psychological level and former resistance zone at $5.38, making it a logical profit target.
• A tight stop-loss at $3.71, just below recent consolidation, helps manage downside risk.
• The trend structure supports a bullish continuation pattern, likely driven by breakout traders.
⚠️ Risk Consideration
• If price closes below $3.71, the bullish structure may break down, invalidating the setup.
• Traders should always assess market conditions and manage leverage appropriately.

SUI Scalp Long Setup – Low Leverage | High RR Trade Idea🔹 SUI Scalp Long Setup – Low Leverage | High RR Trade Idea 🚀
🟢 Entry: CMP $4
📉 Leverage: Low (Recommended)
🎯 Targets:
• TP1 – $4.0400
• TP2 – $4.0800
• TP3 – $4.1200
• TP4 – $4.2000
• TP5 – $4.2800
• TP6 – $4.3600
🔻 Stop Loss: 1hr or 2hr candle close below $3.9200
⚠️ Risk & Disclaimer:
This is a short-term scalp trade setup based on current market structure and price action.
• Use strict risk management.
• Trade with capital you can afford to lose.
• Not Financial Advice – Always DYOR (Do Your Own Research).
• Market conditions can change quickly – stay alert.

Market in Crab Mode, but $SUI Still within Trend – Bidding at $2Bidding CRYPTOCAP:SUI under $2.1.
Although the market looks weak right now, this seems like a simple retrace into a good area. If it manages to hold the weekly trend, I don't see any problem with placing bids in this zone.
I believe BTC will need to create a new yearly low around the 75-76k range for my bids to trigger. For now, I'm fine with waiting.
Still think March will be mostly sideways or down. BINANCE:SUIUSDT

Bitcoin to Small Caps: The Crypto Market’s New Flow of CapitalIn the ever-evolving cryptocurrency landscape, we’re witnessing a significant shift in market dynamics. After months of Bitcoin dominance, capital is now rotating toward smaller cap cryptocurrencies, signaling renewed speculative interest across the digital asset space.
The Flight to Quality Is Reversing
For many months, Bitcoin has maintained leadership in the crypto market. This dominance wasn’t accidental but followed a predictable pattern we often see during uncertain market conditions – a flight to quality. When investors face uncertainty, they naturally gravitate toward assets perceived as safer, which in cryptocurrency means Bitcoin, the largest capitalization asset in the space.
This conservative positioning explains why small cap cryptocurrencies have underperformed since the beginning of the year. Investors were protecting capital by shifting from lower capitalization projects to the relative safety of Bitcoin.
SUI: A Case Study in “Backing Up Action”
The recent performance of SUI provides an excellent example of what’s happening across the market. SUI demonstrates a textbook case of “Backing Up Action” – a technical pattern showing renewed strength after a period of weakness.
Looking at its chart patterns, we can identify several key technical phases:
A selling climax
An automatic rally
A secondary test (which serves as a minor sign of weakness)
The Positive Rotation Effect
What makes the current market particularly interesting is the gradual decrease of supply pressure. This diminishing selling creates the perfect environment for smaller projects to gain momentum as Bitcoin’s gravitational pull weakens.
The declining supply presents exciting opportunities as more assets begin participating in the broader crypto rally. Rather than a single asset (Bitcoin) capturing all the market’s attention and capital, we’re seeing a healthier distribution of interest across the ecosystem.
Looking Forward
The gradual decrease in supply pressure, coupled with this rotation of capital from Bitcoin to smaller projects, creates a promising outlook for the crypto market. While Bitcoin remains the cornerstone of the cryptocurrency world, the health of the broader ecosystem depends on capital flowing to innovative projects across different market capitalizations.

SUIUSDT long setup tf 15minsetup for long position SUIUSDT long setup tf 15min
posible run to target because of broadening wedge descending