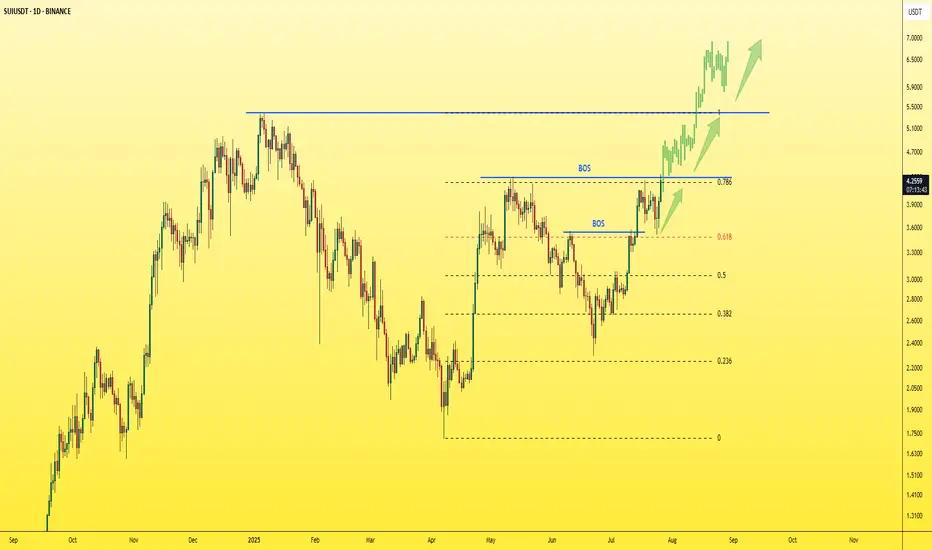
SUI - Just one step away from the explosion!The last candle on the daily chart just confirmed a BOS (Break of Structure) — a clear and strong sign of bullish continuation for the asset.
✅ This is a textbook entry for a long position.
🎯 Next target: $5 — and so far, no bearish signs in sight.
Best regards,
Ceciliones 🎯
Related pairs
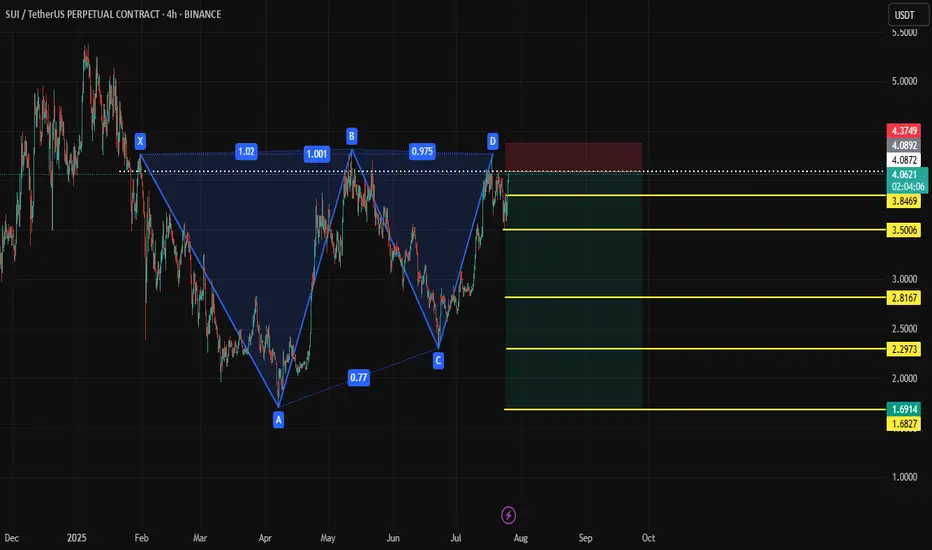
SUI Shortanalysis for sui bearish pattern
Short Entry: $4.10 – $4.20
Stop-Loss: $4.35+
Target 1: $3.60
Target 2: $3.10
Target 3 (Full XA move): ~$1.75 (aggressive)
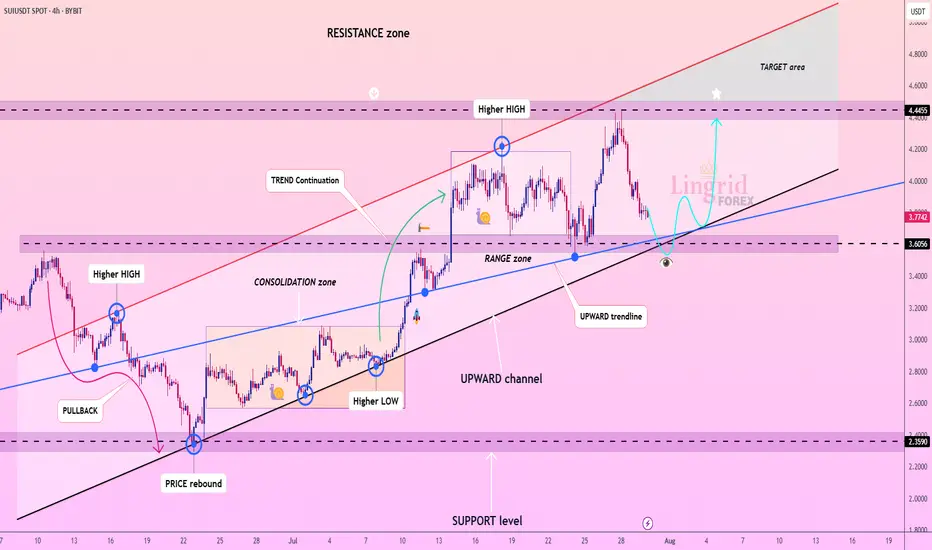
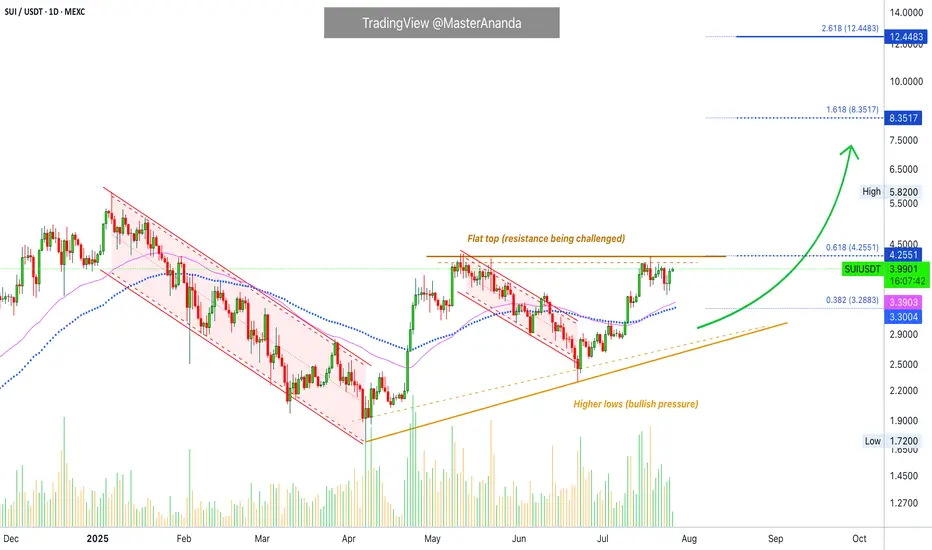
Lingrid | SUIUSDT Approaching Key Level for Potential LongBINANCE:SUIUSDT has pulled back from the 4.44 resistance but remains within a well-defined upward channel, holding above the 3.60 support zone. The structure shows higher lows with price hovering around the blue upward trendline, indicating ongoing bullish momentum. As long as 3.60 holds, buyers ma
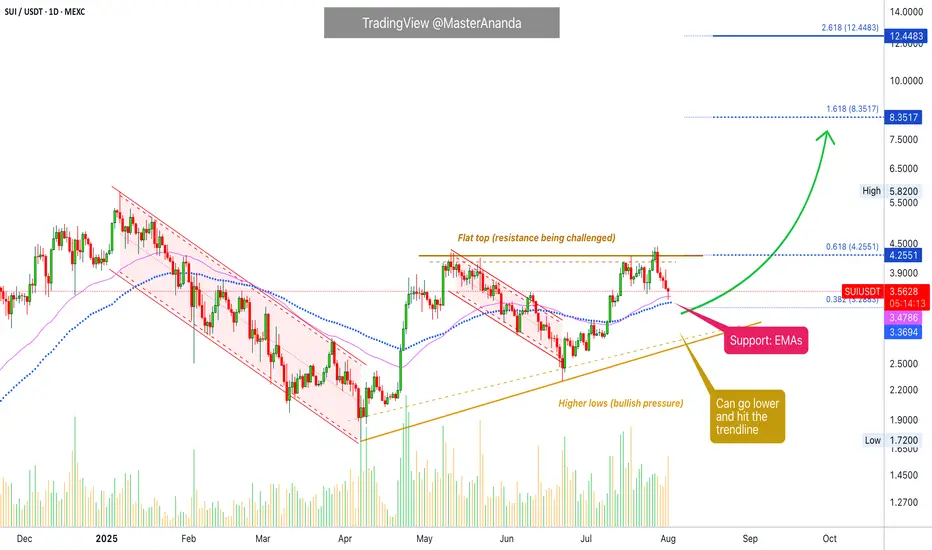
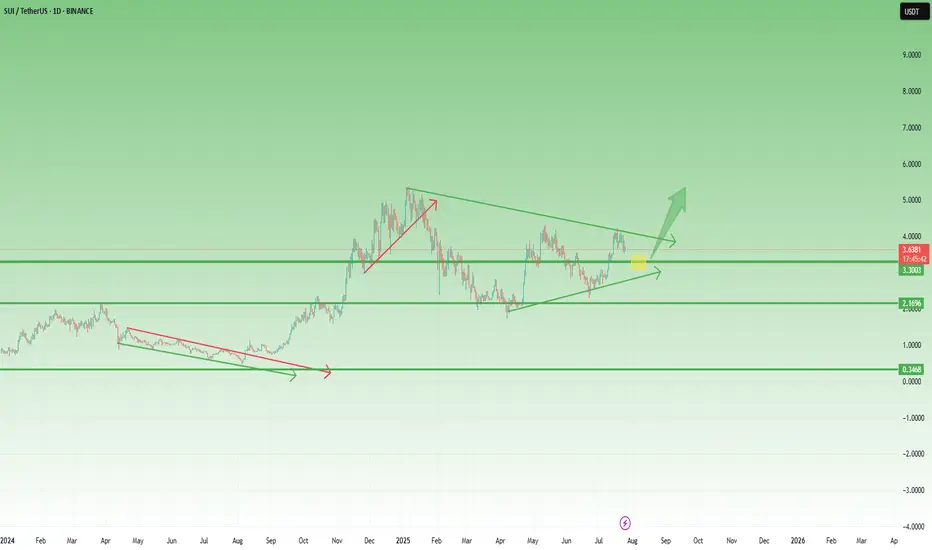
Sui Update · Support Found, Moving AveragesWe will focus solely on the chart. As a move happens, there are always fluctuations, down and up. What determines the trend is not the short-term but the broader market move. When a pair is producing higher highs and higher lows, we are growing and going up. If there is a drop short-term, this is no
SUI Analysis (6H)If you're on the hunt for extreme risks and potentially high rewards — SUI might be calling your name.
Currently, SUI is trending within a well-respected ascending channel, and just today, it tapped both the demand zone and the lower boundary of this channel.
That’s what we call a double support,
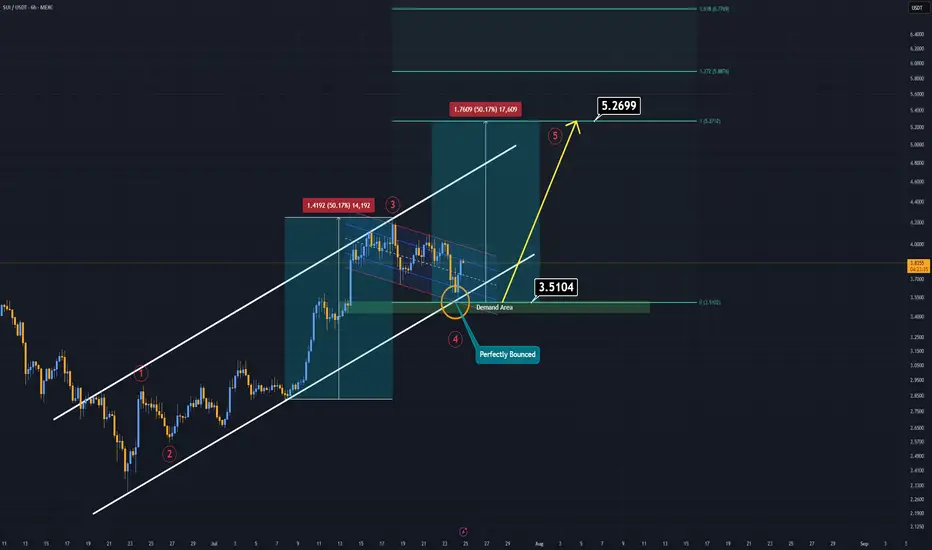
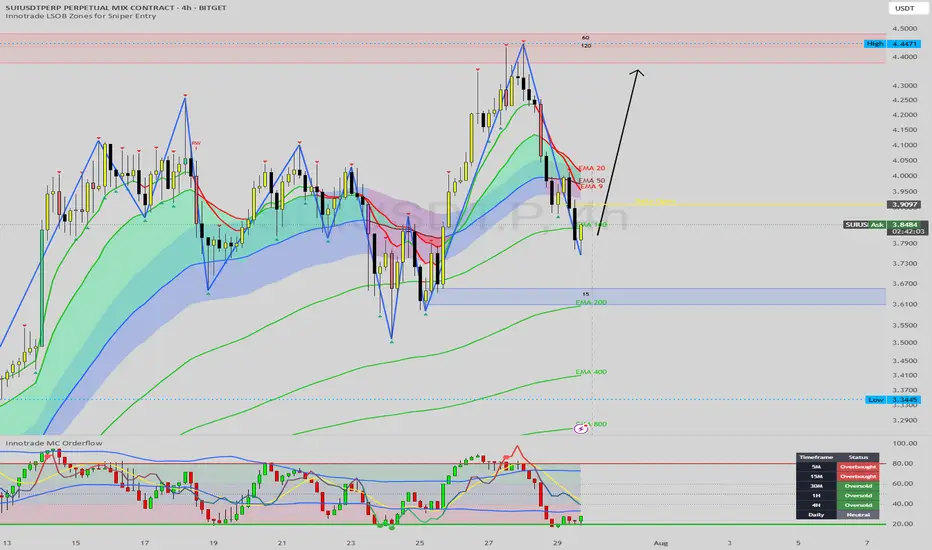
SUI Approaching Major Buy Zone: A High-Confluence Long SetupHello, traders. Today, we're putting SUI under the microscope as it undergoes a sharp but healthy correction following an impressive rally. The price has recently broken below its short-term moving averages, and is now heading directly towards a powerful cluster of technical support. This is a class
SUI – Preparing for a Breakout? Symmetrical Triangle in PlaySince the beginning of the year, SUI has been consolidating inside a classic symmetrical triangle — marked by higher lows and lower highs, a sign of tightening price action and growing pressure.
This kind of structure doesn’t last forever.
Usually, it ends with a strong breakout — especially if sup
Sui Works To Break Resistance · Play To Win · No StressA flat bottom is bullish because support can be confirmed as found when sellers (bears) fail to move prices past a certain point. A flat bottom produces the double-bottom and triple-bottom reversal signals. When the bottom is flat, depending on the phase the market is going through, we can easily sa
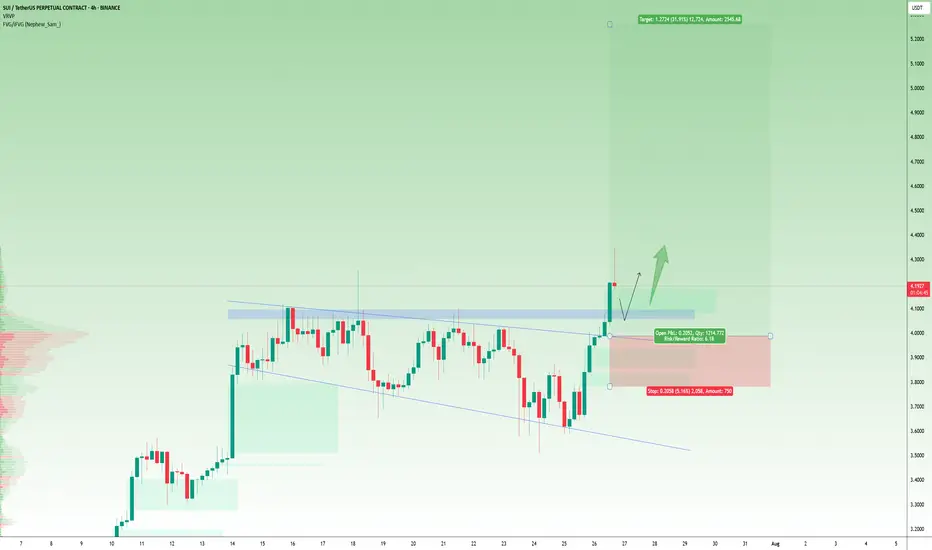
$SUI breaks out with strength!CRYPTOCAP:SUI breaks out with strength, now watching for retest!
SUI has broken above its consolidation range and key resistance zone.
Price is now pulling back slightly, and a retest of the breakout area around $4.00–$4.10 could offer a good continuation setup.
If this level holds, the next le
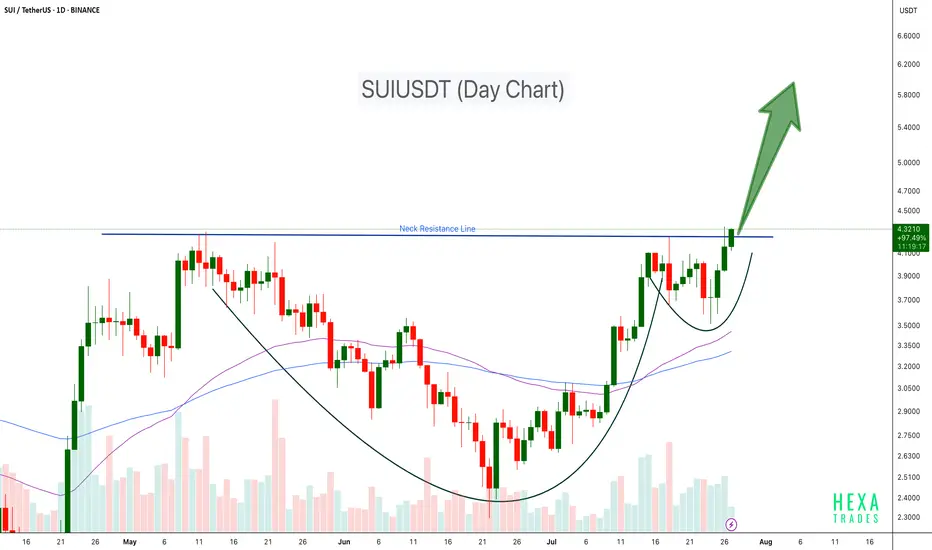
SUIUSDT Cup & Handle Breakout SUI has formed a classic Cup and Handle pattern on the daily chart and has now successfully broken above the neckline resistance around $4.30. This breakout could trigger a strong bullish continuation if volume sustains and retests hold.
Key Points:
Pattern: Cup and Handle
Breakout Level: ~$4.30
See all ideas
Summarizing what the indicators are suggesting.
Oscillators
Neutral
SellBuy
Strong sellStrong buy
Strong sellSellNeutralBuyStrong buy
Oscillators
Neutral
SellBuy
Strong sellStrong buy
Strong sellSellNeutralBuyStrong buy
Summary
Neutral
SellBuy
Strong sellStrong buy
Strong sellSellNeutralBuyStrong buy
Summary
Neutral
SellBuy
Strong sellStrong buy
Strong sellSellNeutralBuyStrong buy
Summary
Neutral
SellBuy
Strong sellStrong buy
Strong sellSellNeutralBuyStrong buy
Moving Averages
Neutral
SellBuy
Strong sellStrong buy
Strong sellSellNeutralBuyStrong buy
Moving Averages
Neutral
SellBuy
Strong sellStrong buy
Strong sellSellNeutralBuyStrong buy
Displays a symbol's price movements over previous years to identify recurring trends.
Frequently Asked Questions
The current price of SUI / UST (SUI) is 3.42020000 USDT — it has fallen −0.77% in the past 24 hours. Try placing this info into the context by checking out what coins are also gaining and losing at the moment and seeing SUI price chart.
SUI / UST price has fallen by −3.58% over the last week, its month performance shows a 34.11% increase, and as for the last year, SUI / UST has increased by 390.91%. See more dynamics on SUI price chart.
Keep track of coins' changes with our Crypto Coins Heatmap.
Keep track of coins' changes with our Crypto Coins Heatmap.
SUI / UST (SUI) reached its highest price on Oct 20, 2024 — it amounted to 15.00000000 USDT. Find more insights on the SUI price chart.
See the list of crypto gainers and choose what best fits your strategy.
See the list of crypto gainers and choose what best fits your strategy.
SUI / UST (SUI) reached the lowest price of 0.36247000 USDT on Oct 19, 2023. View more SUI / UST dynamics on the price chart.
See the list of crypto losers to find unexpected opportunities.
See the list of crypto losers to find unexpected opportunities.
The safest choice when buying SUI is to go to a well-known crypto exchange. Some of the popular names are Binance, Coinbase, Kraken. But you'll have to find a reliable broker and create an account first. You can trade SUI right from TradingView charts — just choose a broker and connect to your account.
Crypto markets are famous for their volatility, so one should study all the available stats before adding crypto assets to their portfolio. Very often it's technical analysis that comes in handy. We prepared technical ratings for SUI / UST (SUI): today its technical analysis shows the neutral signal, and according to the 1 week rating SUI shows the buy signal. And you'd better dig deeper and study 1 month rating too — it's buy. Find inspiration in SUI / UST trading ideas and keep track of what's moving crypto markets with our crypto news feed.
SUI / UST (SUI) is just as reliable as any other crypto asset — this corner of the world market is highly volatile. Today, for instance, SUI / UST is estimated as 4.16% volatile. The only thing it means is that you must prepare and examine all available information before making a decision. And if you're not sure about SUI / UST, you can find more inspiration in our curated watchlists.
You can discuss SUI / UST (SUI) with other users in our public chats, Minds or in the comments to Ideas.