SUI – Prepping for New Highs
CRYPTOCAP:SUI showing clear signs of strength after that reaction at $3.
Starting to build a position here and will add more on a potential Monthly retest—if it comes.
Expecting this to push above $6 and enter price discovery in the next two months.
Could follow a similar path to its October 2024 – January 2025 move. BINANCE:SUIUSDT
SUIUST trade ideas

Sui long to $3.34 are todaySui long to $3.34 possibly today.
Looks like the correction is coming to an end.
Aiming for the highs. On higher tif $3.34 is also daily LH. If market ought to flip bck bullish on the daily it will need to pump pass there.
Roughly 3.6RR for full tp
Stop: $3.1989 or lower

$SUI: $2.95 must hold!CRYPTOCAP:SUI is following the broader altcoin market and entering a correction phase. As shown in the chart, CRYPTOCAP:SUI has already broken through two key support levels and is now hovering just above a critical support at $2.95.
If this level fails to hold, the next major support lies within my green box at $2.20 — which could present a strong buying opportunity.
However, proper risk management is essential — make sure to place your stop losses accordingly.
DYOR (Do Your Own Research).
#SUI #Altcoins #CryptoCorrection #SupportLevels #BuyTheDip #CryptoTrading #TechnicalAnalysis #DYOR
DYOR

Sui Turning Green ($6.65 Target = 100%+ PP)Just like that Sui was red for 24 days. 24 days might not be that long but when you consider that the rise lasted 35 days, then yes, within this context it is a very long retrace... And look at the levels on the chart.
Support found at 0.5 Fib. retracement. This level was pierced followed by a recovery the next day. Double-bullish signal; the recovery and the fact that 0.618 wasn't tested.
I can honestly say that it is still early, but I can also say that this zone where the bounce just happened is a very strong classic support zone. This support zone can lead to the next leg-up, a strong rise with targets reaching $5.19 and $6.65.
The chart looks good for a new bullish wave. The $6.65 target means more than 100%. Taken from the 7-April low, we are talking about a 285% total growth, profits of course. And this wouldn't be the end, only the start.
SUIUSDT has much more to give. We can expect the market to turn and remained green.
Namaste.

SuiUsdt LongTradeable idea, this pair broke through the trendline, as long as it trades above it,look to open long positions.
SUI 650% trade coming up??5 waves up, now correcting. I think it will bounce from the 2.42 area. Nice 650%
Now tring to count 5 waves down for the wave C.
I also see it could bounce from the 0.5 fib and make a cup and handle, but the cup isnt that round. So yeah 2.42 would be my buy zone.

Sui short to 2.84Just recently opened up a short position on sui. Expecting the market to dump down further. All the way to 2.84 down to weekly prior resistance area. Maybe then enough demand will come in to stop the bleeding and flip the trend bullish again.
Until expecting a free fall scenario based on my DTT method analysis.
Stop: $3.1542 or higher.
Time sensitive

Weekly trading plan for SUI BINANCE:SUIUSDT price is very close to the local bottom, but the chart already shows a good bullish divergence and there is a chance to see it worked out. In case of reversal and change of local trend to green, I will consider opening a long position with the aim to see the growth to the first target
In case of negative news the price may update the local bottom, in this case the target may be the 0.5 Fibonacci level. Very detailed description in the video
Write a comment with your coins & hit the like button and I will make an analysis for you
The author's opinion may differ from yours,
Consider your risks.
Wish you successful trades ! mura


Sweep. Reaction. Shift. That’s not noise — that’s the model inBINANCE:SUIUSDT just tapped the lower boundary of its STB 5M, and the market responded instantly.
This wasn’t support. This was engineered liquidity — and it triggered precisely where Smart Money waits.
Here’s the structure:
Price ran the range low and tagged the STB, aligning with 0.618 at 3.1833
This reaction builds into a reclaim of the 1H OB — the same inefficiency that broke structure last time
Next draw is the 0.382 retracement at 3.2631, then 3.3124 — both short-term targets
If volume and structure align, the full reprice to 3.3922 becomes the higher-timeframe objective
Anything below 3.1265 breaks the current long bias — invalidation is clear.
Execution map:
Longs are valid as long as price holds above 3.183
TP1: 3.2631
TP2: 3.3124
Full target: 3.3922
Invalidation: Close below 3.1265
Price isn’t turning because of hope. It’s rotating because it fulfilled its algorithmic sweep.
More setups like this — clean, intentional, and early — are in the profile description.


SUI price analysis If we look at the OKX:SUIUSDT chart globally, you'll see that the April drop stopped at a retest of a strong mirror zone.
And even now, when the CRYPTOCAP:BTC price is trying to correct itself, the #SUI price is very well-supported.
Therefore, globally, any purchase of #SUI while the price is above $2.30 has a chance to turn into a good medium or long-term investment.
📈 On the chart, we have schematically depicted how the #SUIUSDC price may move in the future in 2025 with the final target of $10.8-11.80
_____________________
Did you like our analysis? Leave a comment, like, and follow to get more

Rising Wadge PatternRising Wadge Pattern in SUIUSDT.P Binance Future. This publish only for studying in trading setup, not signal, or recomendation trade. Just for capture my trade for studying. Thanks

SUI conditional breakout setup — Wait for Flip of BOS ZonePrice is currently testing a Break of Structure (BOS) zone near $3.26–3.46. However, the structure remains bearish as long as price remains under this zone. The long setup is only valid after a confirmed breakout and retest.
Setup:
🟩 Buy Trigger: Break and retest above $3.46
• No trade while price remains under the box
• Breakout + retest = confirmation to enter longs
• Target - resistance cluster around $5
• Stop-loss: below recent swing lows
📌 BOS Zone: $3.26–3.46
• Acting as a key inflection zone
• Once flipped, becomes the base for continuation higher
🚫 No longs inside/under box — wait for clear structure shift
Summary:
Setup requires patience — this is a breakout-retest strategy, not a bottom-picking one. Let the chart confirm direction before entering.

#SUI/USDT#SUI
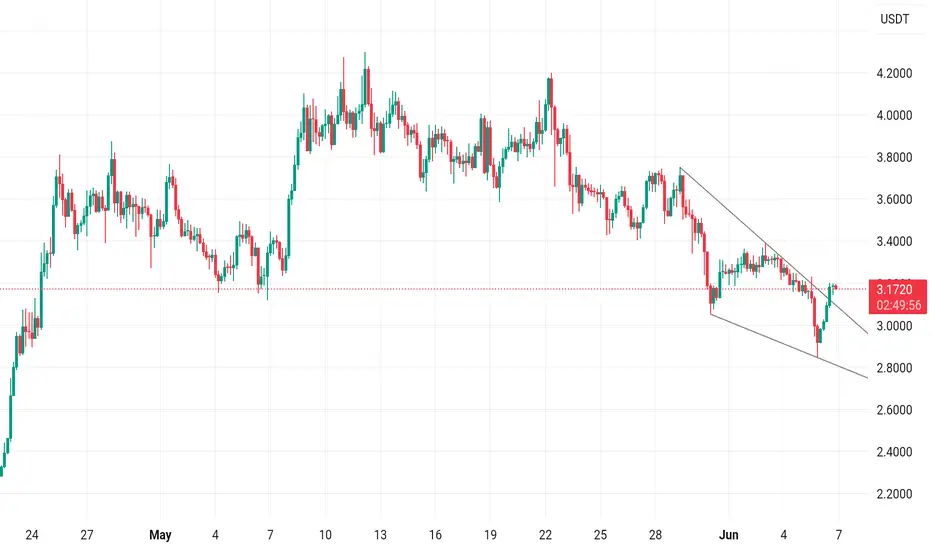
The price is moving within a descending channel on the 1-hour frame, adhering well to it, and is heading toward a strong breakout and retest.
We are experiencing a rebound from the lower boundary of the descending channel, which is support at 3.10.
We are experiencing a downtrend on the RSI indicator, which is about to break and retest, supporting the upward trend.
We are heading toward stability above the 100 Moving Average.
Entry price: 3.30
First target: 3.34
Second target: 3.57
Third target: 3.76

#SUI/USDT#SUI
The price is moving within a descending channel on the 1-hour frame, adhering well to it, and is heading toward a strong breakout and retest.
We are experiencing a rebound from the lower boundary of the descending channel, which is support at 3.10.
We are experiencing a downtrend on the RSI indicator, which is about to break and retest, supporting the upward trend.
We are heading toward stability above the 100 Moving Average.
Entry price: 3.30
First target: 3.34
Second target: 3.57
Third target: 3.76

SUI NEW VOLUME UPCOMINGSUI shows on a low time frame new upcoming volume, which can allow SUI to break soon.

SUI analysis In this video I go through the recent bullish trend in SUI and anticipate where I think the retrace will take us for a possible long entry . I also highlight a possible short setup off of the Value area high if it comes in .
Tools used in the video TR Pocket / Fibs , Volume Profile and Pivots .
Appreciate your support any questions then please leave them in the comments
Have a great day

SUI – Multi-Timeframe Support TestCRYPTOCAP:SUI COINBASE:SUIUSD BINANCE:SUIUSDT
🟣 CRYPTOCAP:SUI is re-testing a major weekly channel support near $3.15. A strong defense here could trigger a solid bounce 🚀.
📊 Meanwhile, on the 4H timeframe, price is holding a crucial horizontal support.
👀 Stay alert — whether it breaks down or reverses, it could be a big move ahead!

SUIUSDT | Bullish Scenario Hello everyone.
Everything is clear in the video.
Summery
Order block zone: 3.3692-3.2294
SL: 3.2041
TP: 4.1961
I Share my ideas with you and the only thing you have to do is supporting.
Thanks.

Long SUISUI has formed an accumulation pattern based on the Wyckoff method. The Sign of Strength (SOS) phase appears to be complete, and SUI is now trending higher
Long setup is as in chart.
Disclaimer:
This analysis is based on my personnal views and is not a financial advice. Risk is under your control.

Current market updateWe’re seeing multiple setups across many altcoins — but one of the best right now is on SUI.
The major trend reversal zone and the bearish target region are overlapping, giving us a high-probability setup.
Those who position themselves well in altcoins now will be happy in the coming days and weeks :)

$SUI | 4h - 12hKey support held at swing low.
Looking for a strong move to $4.1 if bulls keep control.
Lose $3.42 — next support $3.22–3.33.
Break below $3.22 — bulls out, bear party starts.
Wait for confirmation, don’t rush.
