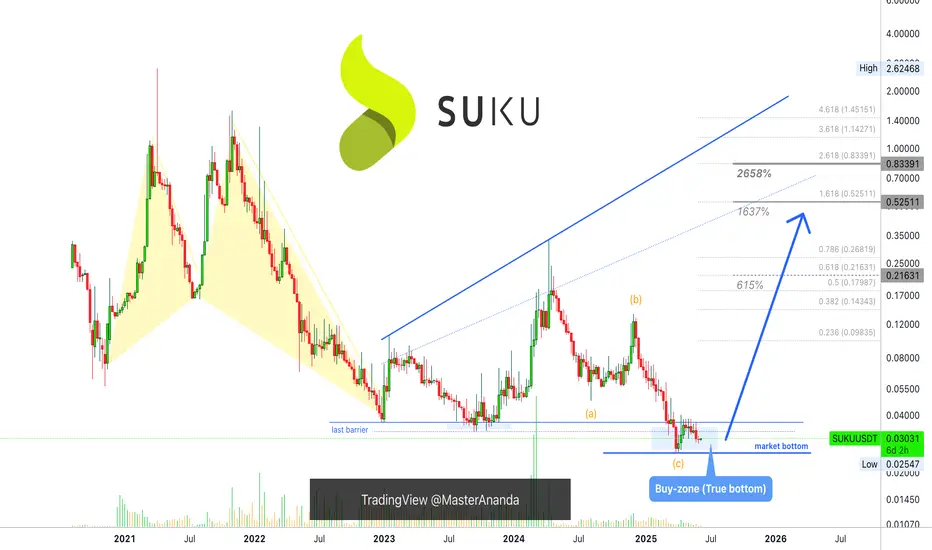
Suku, High Targets Only (615% - 2,658% Profits Potential)Between late 2023 through mid-2024, SUKUUSDT produced a 900%+ bullish wave. The action in late 2024 was a non-event.
Here we can clearly see how a pair that grew strongly in 2023 performed poorly in 2024. Those that performed poorly in 2023 did great in late 2024. But still, this isn't bull market type of action.
SUKU can grow more than 900% in a transition year, this is awesome. How much can it grow in a bull market year when everything goes wild? Great question. Growth potential is huge.
I am showing some targets here, strong targets but the possibilities exist for this pair to grow even more than what is shown on the chart. This is a small cap. and small cap. projects can do awesome when the bull market is in full force. Right now, we are not there yet.
SUKUUSDT is trading at the bottom, true bottom; the lowest prices ever in its entire history. This is simply great. You can't go wrong buying when prices are low. No planning needed, just buy and hold.
Risk becomes very limited, it can be counted in time, nothing more. While the reward potential can be extraordinary, off the chart.
A spot trader can simply buy and accumulate. If you are reading this now, you have great timing. The only time better than now was in early April, but the retrace pushed prices back near the same level, so everything is good.
Three months from now you will be dealing with a completely different market, you will be surprised to see how fast things change. Now everything is low and depressed, in a several months, you won't even be able to imagine that such a situation as now is even possible. Everybody who missed the train will be thinking, "why didn't I buy back then?"
Take action now.
Thanks a lot for your continued support.
Namaste.
SUKUUSDT trade ideas
SUKU's Potential BreakoutSUKU is on the brink of breaking out from its falling wedge on the 4-hour chart, targeting the golden Fibonacci range between $0.23 and $0.26. Historically, SUKU hit the $1 mark twice during the crypto bull runs of 2021 and 2022. The recent launch of SukuPay, a decentralized digital wallet that allows users in over 150 countries to transact using just their phone numbers, fuels optimism for reaching these heights again.
Altcoin seasons often start a few months after Bitcoin halving events, suggesting possible gains by year's end.
Nonetheless, there's a notable risk: one entity holds 85% of the circulating supply, as recorded on Etherscan. Despite this concentration, no significant sell-offs occurred from this entity during prior peaks when the token value approached $1.5. This stability implies that major stakeholders, potentially including CEO Yonathan Lapchik and CTO Lucas Henning, are in for the long haul. Given the gradual adoption of Web3.0—seen as the next big phase in tech trends after NFTs, the Metaverse, meme coins, and AI—SUKU's potential to reach a market cap of 500 million, a 20-fold increase from its current valuation appears promising.

✴️ Suku (Name Your Altcoin) Chart Analysis (100% Potential)Good evening my dear friend and Cryptocurrency enthusiast, join me for a few minutes while we look at this chart.
SUKUUSDT is good to me, meaning, it looks good to me based on the experience gathered after years on end looking at charts.
➖ Notice the left side.
The rounded bottom leads to a bullish wave.
➖ Notice the right side.
A double, rounded, bottom will lead to an even stronger bullish wave.
SUKUUSDT is trading above EMA200, long-term growth potential is active now.
A major corrective downtrend is over.
👉 Here I am mapping an easy 100% bullish jump but there will be more, much more long-term.
Thank you for reading.
Allow for price fluctuations.
Namaste.

scape from patternexit from green pattern
break up red resistance line.
exit from weekly red kumo cloud ....
If it stabilizes above the red resistance, good growth awaits it

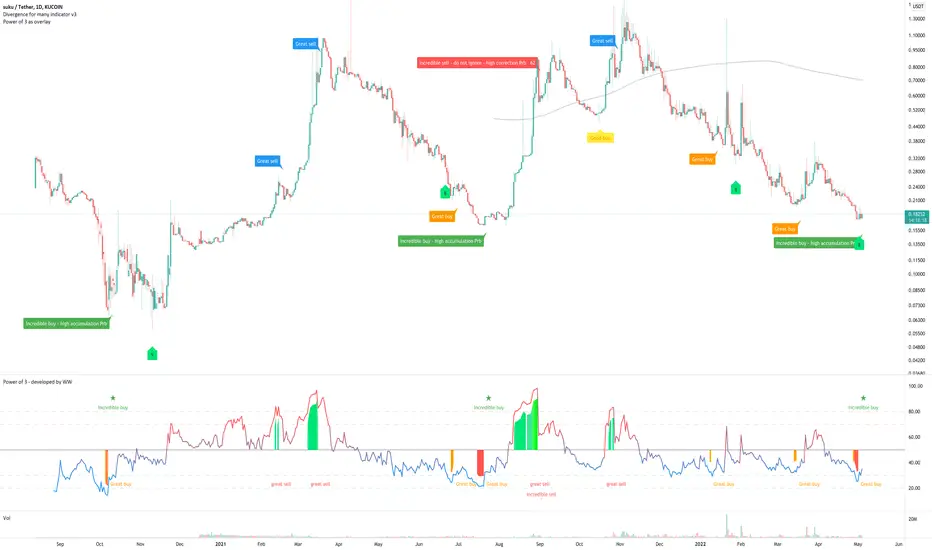
SUKU - Bullish divergenceShout out to @unknownpower
On the above 1-day chart price action has corrected 90% since early November. A number of reasons now exist to be long, including:
1) The ‘incredible buy’ signal. Look left.
2) Regular Bullish divergence. Currently 8 oscillators are printing divergence. Excellent. Easier to see on 3-day chart below.
3) On the 2-day chart (below) price action is testing past support at the same time price action breaks out of resistance. Fantastic.
Is it possible price action falls further? Sure.
Is it probable? No.
Target: $1.50
Good luck!
Ww
Timeframe: 1-3 months
Risk: 3% or less of portfolio
Return: Minimum 10x
3-day printing bullish divergence
2-day chart - price action breaks out of resistance
$suku relief rallyCOINBASE:SUKUUSD $suku finally having a relief rally after 6 months of consilidation

$suku will moon on Nasdaq listing of infiniteworldbysukuSuku will moon once the listing of JPG takes place on the Nasdaq by the end of Q2 2022

SUKU: a promising project and chart.Suku is on of the 100 blockchain start ups listed on forbes. It's currently very low in capitalization and this give us a good long opportunity!
The cap is currently 40$M, this means that at 6.30$ the cap would be around 600$M. I think this is higly achievable for a project of this kind.
Suku is a service kind of project, this means they let companies use their network to give customers a new way of approach to the world of services. This goes from supply chain, interoperability to DeFi.
It's also a project in partnership with hedera hashgraph and suku network will be integrated in hedera network, this will make suku safer, scalable and fast than ever, making it one of the best project in the crypto world.
This project is a gem and it's very discounted right now.
Technical analysis:
Suku price is following this trendline for long time now, it looks very solid.
If this is the bottom the fibonacci extensions would take it to around 6$ during the next bounce. It's a high target but it's definitely reachable in the medium-term. And remember that low volume preceed expansion!
Here for you, as always, CryptoSoap!

SUKU - Small Market Cap Gem (only 60Mil!) on Coinbase!Whales/elites will not miss any opportunities into making money. They simply buy the fear, hype up the market, take profit and crash it again after taking profit. Instead of beating then, lets ride with them! ;)
Before reading, get rid of your moonboy mentality and no emotions for dips/corrections! Cannot rule bearish scenarios! Dips are for buying!!
People are so focused on the hourly/daily timeframe that they get emotional on every dip! Take a step back to the weekly/monthly timeframe and see why I'm so bullish now. Stop looking at the short-term dips/rise. Short term is irrelevant for the move that is coming!
You can't be emotional in these markets (stocks, forex, crypto, real estate, etc.). You will lose this game following the news and doing what the majority does. News creates emotions. Everything you need to know are on the charts. News is manipulated by the elites, and they take advantage of our emotions. Stop listening to the news and pay more attention to the charts. Don't follow the majority, because the majority will lose in the end! Also, don't buy the hype when everyone is buying.. instead buy the fear when everyone else is selling
Everything is on the chart! Cryptocurrencies are on the verge of exploding higher. Dips/Corrections are normal and needed in a bull market and are buying opportunities! Huge gains opportunity in the coming months! Never trade blindly. Use multiple indicators to make calculated decisions. Trade with no emotions!
Facts:
1. Are we creating another falling wedge?!
2. Stochastic RSI - Awaiting bullish cross and above the 20 level! We are close!
3. RSI - Highly oversold on the weekly! Each time we bounce off trendline, we 10x-37x in price!
4. Small Market Cap Gem! Only $60 Million Market Cap! Lots of room to grow!
5. In all the biggest exchanges, including Coinbase!
Buy and Sell Targets: Check the chart!
"If you can't beat the fear, do it scared!"
"Be fearful when others are greedy, and greedy when others are fearful!" - Warren Buffet.
"Markets are a device for transferring money from the impatient to the patient. - Warren Buffet
"Show me the charts, and I'll tell you the news." - Bernard Baruch
"The secret to investing/trading is figuring out how rich you want to be and how poor you're willing to become."
"If you want to live like the 5% of the population who are hugely successful, then don't act like the 95%!"

SUKU/USDT { SUKU } - BULLISH SETUPANALYSIS 🔎
- SUKU/USDT is currently on an uptrend supported by the ascending trendline support.
- The market hit a swing high and retraced.
- Price is retesting the key fibonacci retracement zone (0.618 - 0.702 - 0.786) and ascending trendline support.
- There's a relatively high concentration of buyers at this zone (high buying pressure).
- The retracement was resisted by the descending trendline resistance.
- Price brokeout above the descending trendline resistance.
- This is a bullish signal.
- The market could be on the verge of the 5th impulsive Elliott wave.
BUY ENTRY ⬆️
- Key fibonacci retracement zone (0.618 - 0.702 - 0.786).
TARGETS 🎯
- Horizontal resistance level (@1.07541).
- Horizontal resistance level (@1.25106).
- Horizontal resistance level (@1.58302).
- Fibonacci extension level 1.0 (@1.84350).
SETUP INVALIDATION ❌
- Breakdown below the 0.786 fibonacci retracement level (@0.70033).

Suku/usdt analyse chart 8Nov 2021Good position
Super momentum
Enter 1.16$
Targets: 1.18 1.20 1.24
Sell: 1.12$ (Day close candle)
Good luck :)

SUKU-USDTBest buy price ( red line ) or after breakout and retest it .
Sell on Green lines
DYor plz
It isnot a financial advice
Good luck

LongHi guys it looks like a cup and handle pattern is complete and you have to wait to hit the targets.
#signal
#SUKU
#SUKUUSDT
Spot( Midterm)🌟
Enter : 1.2$
Target : 1.6$
Target : 1.9$
Target : 2.8$
Stop loss : 1$

SUKUUSDT DailyHi guys, if the resistance line is broken, buying it can be profitable, but since this crypto is 355th,
it is better to buy less because its trading volume is lower and it has more risk ...
Good luck, don't forget to like, thank you

suku usdtsuku is forming an inverse head and shoulers pattern which is very bullish .once we break the neckline it could be a good buy
not financial advice.DYOR
