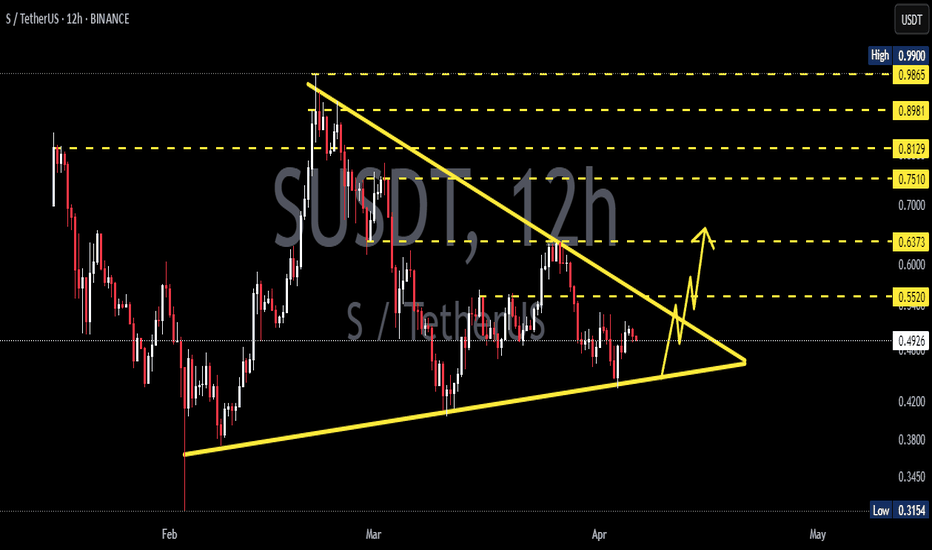
SUSDT trade ideas
Short-Term Trading Plan for S/USDT (4H Chart)1. Entry Zones:
Conservative Entry: Wait for a pullback to the 0.4993–0.4880 support zone (around Fibonacci 0.236 level).
Aggressive Entry: Enter after a confirmed breakout and strong bullish candle close above 0.5163 resistance.
---
2. Take-Profit Targets:
---
3. Stop-Loss Levels:
Conservative Entry SL: Below 0.4700 (beneath Fib 0.382 support).
Aggressive Entry SL: Below 0.5100 (in case of false breakout rejection).
---
4. Risk/Reward Ratio (RRR):
Conservative Entry: ~2.5 to 3
Aggressive Entry: ~1.8 to 2.5
---
5. Entry Confirmation Checklist:
Bullish crossover in Stochastic RSI
RSI holding above 50
Strong bullish candlestick pattern (e.g. Marubozu, Bullish Engulfing)
---
6. Additional Notes:
Use position sizing (e.g. 30% initial, 30% on pullback, 40% after breakout)
Move SL to breakeven after TP1 hits
Consider trailing stop for TP2 and
SUSDT Still in Trouble – Is the Worst Yet to Come?Yello, Paradisers! Are you letting this short-term bounce on #SUSD fool you? Be careful. What looks like a recovery could just be a deceptive pause before the next major drop hits.
💎After topping out just shy of the psychological $1.00 mark, SUSDT has entered a significant zigzag corrective structure. Despite the recent bounce, the bigger picture still suggests that the market is setting up for one more leg to the downside, where the real bottom might finally be reached.
💎#SUSDT has printed a short-term double bottom around the $0.38 level, positioned slightly above a moderate support zone. This has triggered a minor bullish push, offering a temporary sense of relief for bulls. However, based on the current market structure, this move is likely to be short-lived and part of a broader corrective pattern.
💎The resistance zone between $0.465 and $0.4720 is now the key level to watch. It’s a strong supply area where selling pressure is expected to return with intensity, making it difficult for buyers to gain control. If price gets rejected from this zone, a drop back toward the $0.3740 level is highly probable, as this area serves as the next moderate support.
💎The structure on SUSDT is far from done to the downside. If the rejection plays out as expected, the price could slide even lower, targeting the $0.3300 to $0.3150 range. This is where the final drop may conclude and a proper base for recovery could finally be established.
Paradisers, strive for consistency, not quick profits. Treat the market as a businessman, not as a gambler.
MyCryptoParadise
iFeel the success🌴
#SUSDT.P -A New Upside Opportunity with the Cup and Handle Hey everyone,
Today’s analysis is for #SUSDT.P. We’ve got a solid Cup and Handle formation here, and I believe it’s set to play out well. The ideal long entry zone is between 0.53-0.56, with short-term targets at 0.60 and longer-term targets at 0.66.
Just like our BINANCE:REDUSDT.P analysis from yesterday, I’m rooting for this one to hit its targets quickly. Wishing you all a green-filled day ahead!
What do you think of my analysis? Let’s meet in the comments and discuss!
Manage your risk, stay in the game! 🎯🔥
#AlyAnaliz #TradeSmart #CryptoVision #SUSDT
SonicCoin (SUSDT) Trading in a Descending ChannelHello Traders,
Today, we’re analyzing SUSDT (SonicCoin), which is currently trading within a descending channel—a bearish pattern where price tends to gravitate toward key boundary points. Recently, price action was rejected at channel resistance, an area that confluences with the value area high at 0.6185. This rejection has shifted the previous uptrend into a more bearish outlook, as price has now taken out prior lows, confirming the rejection as strong.
At present, SonicCoin is trading around the POSC (Point of Structural Control), hovering near the channel midpoint while liquidity continues to build. If buyers fail to reclaim the channel high resistance, this liquidity could fuel a cascade move lower, potentially sending price towards the $0.26 support region.
Points to Consider
• Descending Channel Structure – Price remains within a bearish pattern, respecting key resistance and support levels.
• Liquidity Build-Up at Midpoint – Current price action is consolidating around the channel midpoint, which could lead to a breakout or further downside.
• Potential Drop to $0.26 – If strength does not return, a liquidity-driven move toward key support could be next, offering a potential long setup from lower levels.
Market Outlook & Trade Considerations
SonicCoin is currently range-bound within a downtrending environment, making it a market that requires careful risk management. If price action remains weak below resistance, the probability of a breakdown into $0.26 increases. However, should buyers step in at that level, it could present an opportunity for a long play back into channel resistance.
For now, traders should monitor whether price can regain strength above channel resistance or whether the liquidity build-up leads to a deeper correction. Confirmation signals will be crucial before entering any trades.
Overall, SonicCoin remains in a bearish structure for the time being. Until price decisively breaks above resistance, the risk of further downside remains in play
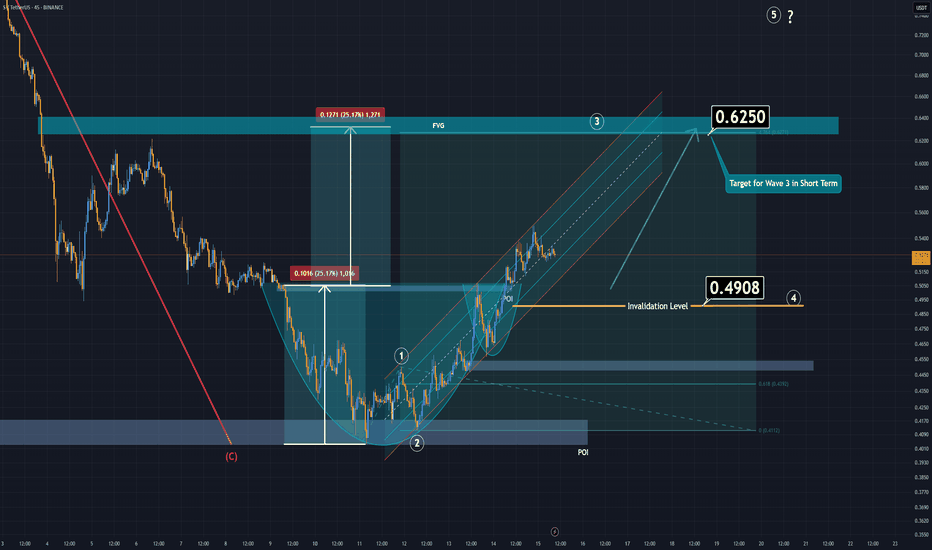
S (The Ex FTM) Has Formed a Bull Pattern and in Wave 3In short time frame the S, AKA "Ex FTM" has formed a Cup&Handle pattern. The breakout has already copleted. If it can stay above the invalidation level, S can reach the level 0.62 easily.
For a better perspective for long term, S also completed it's Bearish A-B-C waves and seems bullish again.
Good Luck.
S (Ex FTM) Next MoveAt the moment, S is going in a parallel channel through upwards. Either right from around here or from a lower demand zone, S will be going through 0,63 level.
It's a low risk trade and might be usefull.
Below the are 0.58 which is marked on the chart might be dangerous and would be a usefull stoploss.
If you can follow the chart in low time frame wait for a 4 hour candle close before stop the position if it reaches the invalidation level.
S Trade Setup - Waiting for Retrace to SupportS has had a strong rally over the last two weeks and is now at resistance. We’re waiting for a retrace to the next support level before entering a long spot trade.
🛠 Trade Details:
Entry: Around $0.55
Take Profit Targets:
$0.62 (First Target)
$0.74 - $0.80 (Mid Target)
$0.91 - $0.98 (Extended Target)
Stop Loss: Just below $0.48
We'll be watching for confirmation of support before executing the trade! 📈🔥
S/USDT: FALLING WEDGE BREAKOUT!! 🚀 Hey Traders! SONIC Breakout Alert – ATH Incoming? 👀🔥
If you’re excited for this setup, smash that 👍 and hit Follow for premium trade ideas that actually deliver! 💹🔥
🔥 SONIC/USDT – Breakout & Retest in Play! 🚀
SONIC is breaking out of a falling wedge on the 4H timeframe and is currently retesting the breakout level. With momentum building, we’re expecting a move toward ATH soon.
💰 Trade Setup:
📍 Entry: CMP, add more up to $0.50
🎯 Targets: $0.56 / $0.62 / $0.69 / $0.78 / $0.85 / $0.96
🛑 Stop-Loss: $0.46
⚡ Leverage: Low (Max 5x)
🔎 Strategy:
Enter with low leverage now
Add more on dips and ride the wave higher
💬 What’s Your Take?
Are you bullish on SONIC’s breakout? Share your analysis, predictions, and strategies in the comments! Let’s lock in those gains and ride this pump together! 💰🚀🔥
S - Roadmap to $1S has been overall bullish trading within the rising channel marked in blue.
Currently, S is retesting the upper boundary of the channel and a key structure at $0.63.
For the bulls to stay in control and aim for the $1 round number, a break above $0.63 is needed.
In the meantime, if S retests the lower boundary of the blue channel and the $0.50 round number, we will be looking for trend-following long opportunities.


