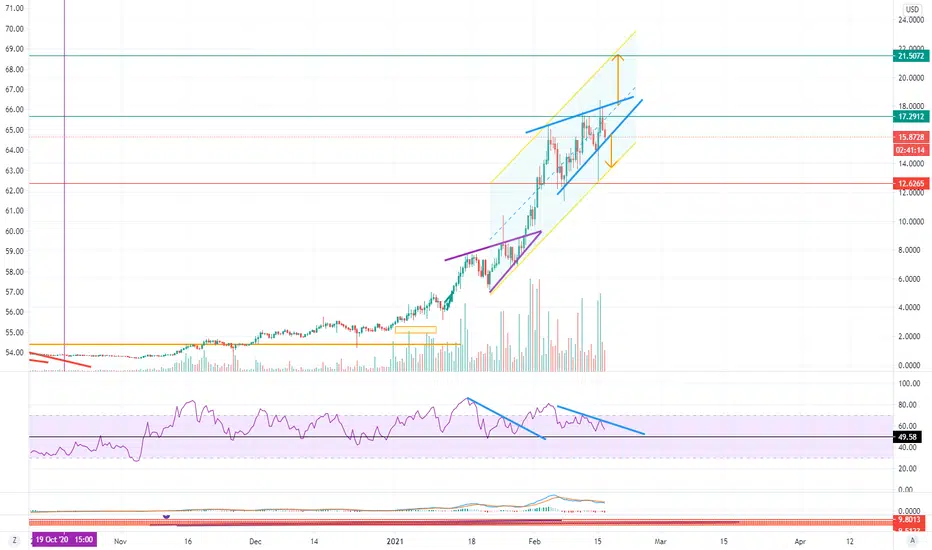
SUSHI should be on your plateThis is a very bullish setup where Sushi consolidates from being overbought while continuously setting higher lows. Be patient and the tastiest Sushi will come to you.
SUSHIUSD trade ideas

SUSHI AND LINK targets on the 4hourChart pick based on proprietary screener which changes daily.
Targets by TRADING_PIVOTS.
For entertainment purposes only. These posts do not consider any fundamental analysis.
Today's list www.screencast.com

$Sushiswap - Going to MoonSushi like many other of my Altcoins look ready to rocket.
The price has broken out of the short-term downtrend to begin a long-term uptrend.
A great tip for newbie traders.
ALWAYS look to buy a short-term downtrend in a long-term uptrend like my Sushi chart 💪😍👍
NEVER buy a short-term uptrend in a long-term downtrend like bitcoin 💪🐻👍

Sushi can be deliciousEverything is marked onthe chart for you friends. Possible scenario if the base band is maintained.
If its useful like it please and follow me for future analysis :)


Crypto Market & SUSHI Technical Analysis & Predictions 3/4/21*DISCLAIMER: I am not a financial advisor and this is not financial advice as these are purely my opinions and speculations. I may also own or trade any of the symbols and cryptocurrencies mentioned in this video so do not make your trading or investing decisions based on this video. I do not guarantee any results nor am I responsible for your actions. You should always do your own due diligence before trading or investing in this market as it is extremely risky. Affiliate links are also included in this same video description section here and if you decide to support me by using any of them, I may receive a referral bonus or commission.
*Follow me for the latest cryptocurrency analyses on my watchlist
*Thank you to those who donated, I very much appreciate it.
*Let me know in the comment section if you agree or disagree, would love to hear your ideas too.

Sushi bullish--possible swing playSushi looking ok so far, hitting the first target. Good day for a sushi breakout, but I do think we may get the chance to buy again in my original entry point.. May happen anytime in next day or so.


Sushi rising wedges that break upI don't know any more if rising wedges break up or down. Last one broke up. This one is a tad different in that the RSI didn't pullback to support, so I imagine it should break down as the RSI tries to reach support.
If sushi continues up, it can be generalized for all alts and vice versa. Market has been quiet after these last days of volatility, probably to decide on the direction.

Sushi set for an ATH retest and then off to the next Fib level.Sushi has had a considerable run up along with other DeFi tokens in the last few weeks. It is consolidated after hitting an ATH and is set to retest that ATH and possible continue on with a potential of hitting $20 as the next fib train stop suggests.
This is my opinion and my own opinion only. Not financial advice.

SUSHI/USD 1H Bat patternPlease Like & Subscribe!!! Thanks !!!
SUSHI/USD 1H Bat pattern
#Buy-TP 1=14.19400000 TP 2=15.10140000
-------SL=11.67100000

Did you order sushi?Small but strong, wolves🔥
Now we have a trade opportunity on SUSHI/USD. Symmetrical triangle on 15 min frame.
Previously it had bullish sentiment.
All the waves are done and now the price is approaching to breakout point
So, follow the chart carefully and look for the breakout
If you enjoy my FREE Technical Analysis , support the idea with a big LIKE👍 and don't forget to SUBSCRIBE my channel, you won't miss anything!
Feel free to leave comments✉️


SUSHI all good things come to an endRising wedge with bearish divergence most likely to breakdown. Breakup still possible with targets of 13 and 15 dollars but ETH needs to achieve new ATH.

Long on $SUSHI for $15.55I went long on $SUSHIUSD as soon as Super Algorithm Indicator called bullish on 4 hour timeframe.
My target is $15.55 jusy below the fib number as shown.
And my stop is based on the fib as well as can be seen.
I am in profit and holding this gem

Sushi have two paths ahead Sushi is one of the cryptos with more staking holders on Binance, that makes me believe that is one of the candidates to contra trade BTC if it fall.
Just like ETH, LINK, ADA, and other staking assets.
What do you think?


Attention: The next level of resistance for SUSHI is at $8.9SushiSwap #SUSHI is ready all set to go to the moon !

SUSHI - $14If Sushi can break the resistance at $8.56 and flip it to support, we could start seeing a move towards $9.36, $10.39 and $13.37. Failure to break the resistance at $8.56 could lead to a drop towards $6.98 and $6.04.


SUSHI Descending Expanding Wedge Breakout ImminentHello SUSHI lovers!
SUSHI has been in a descending expanding wedge since mid January. Currently, price is once again pushing against the top side of the wedge.
If BTC goes sideways or continues its bullish ascent, the I suspect SUSHI will breakout and head to the next area of strong resistance around $8.75!
If the bulls push past $8.75, then the next area of strong resistance is around $10.00-$10.50.
Currently, 1H-4H stochastics are all up, suggesting short-term bullishness. This may be the momentum SUSHI needs to break through resistance!
Short-term Price Targets
In this chart, we can see some medium-term, Fibonacci targets.
We can see that the 3.618 comes in at $10.21, which has confluence with the horizontal support/resistance zone around $10.50.
The 4.236 Fibonacci comes in around $11.85 and the 4.618 Fibonacci comes in around $12.90.
I suspect SUSHI will reach and potentially surpass, all these Fibonacci targets and if/when price finds support above $9.25, price action will rip up!
Medium-term Fibonacci Targets
Long-term Fibonacci Targets
The longer-term Fibonacci targets come in at:
1.618: $9.26
2.618: $14.61
3.618: $19.96
4.236: $23.26
4.618: $25.31
---
Guide to My Charts
-The dark magenta horizontal lines are support/resistance 'zones'. If price pierces though one side of the support/resistance zone, it is likely to head to the next support/resistance zone!
-Yellow lines are typically used to chart out pattern formations and trend lines!
-The colored lines are MAs (Red: 10SMA, Yellow: 21EMA, Green: 55EMA, Blue: 89EMA, Purple: 200EMA, White: 200SMA, Maroon: 377EMA).
-Horizontal white and green lines may be Fibonacci levels. The 0.382 and the 0.618 Fibs are green and the rest are white.
-The Historical Volatility Percentile, RSI , and/or stochastics indicators are below the chart if displayed.
---
Please smash the like and comment if you find value in this post! It helps show me that others are interested and motivates me to share more with the community!
---
Disclaimer:
This is not financial advice; I am not a financial adviser. This information is not meant to be used for financial advice, nor trade ideas. These posts are simply a record of my technical analysis and potential trade setup ideas.
These posts are intended for educational purposes only. It is imperative that everyone conduct their own research prior to entering any trade.

Longed $SUSHI at 6.15 - Looking to TP around the 7.20 region$SUSHI looking interesting for a long at this stage, retesting and bouncing on previous support of 6.15. Hourly support holding up and looking nice for a long position.
Entry at 6.15 and looking to take profit around the 7.15-7.30 region. Stop set at 5.85.
Trading obviously comes with risks and as always this is not financial advice, just my thoughts.
