Sushiswap 1,2 Breakout Sequence Can Lead To New ATH (3,000% PP)On this chart and after reaching a market bottom Sushiswap produced a clear 1,2 breakout sequence. This sequence has been shown to produce a bullish wave.
You know what they say, "Third time's a charm," and we are on the third breakout from a long-term support.
1) In early June 2023 we have the fi

SUSHI Nice Structure, Keep in WatchlistSushi has nice price structure
0.4 is good buying opportunity
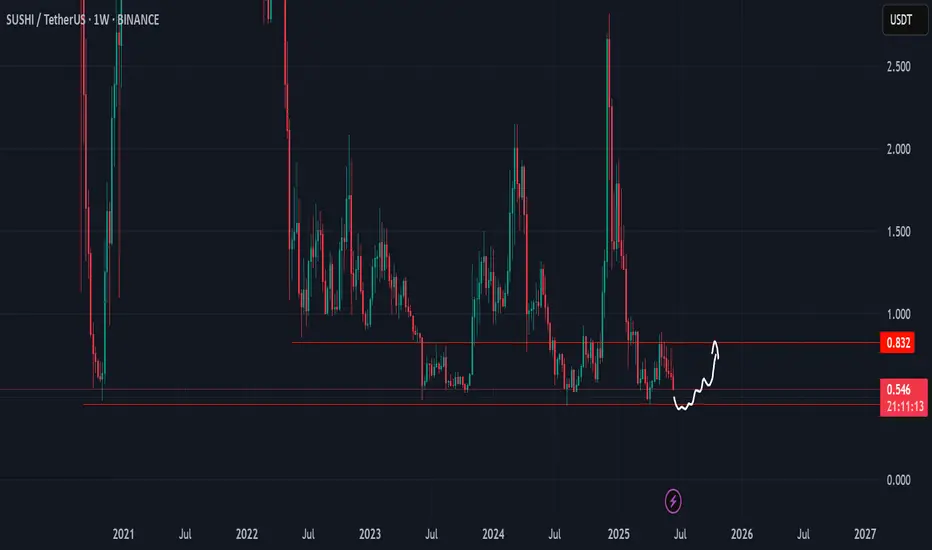
SUSHI/USDT Reversal from Historical Demand ZoneThe SUSHI/USDT pair is showing strong potential for a bullish reversal from the long-term demand zone between $0.44 - $0.58, which has historically acted as a solid support area since 2021. Price has tested this zone multiple times and has bounced back, indicating significant buying interest.
🔍 Tec

#SUSHI/USDT#SUSHI
The price is moving in a head and shoulders pattern on the 1-hour frame, adhering well to it, and is heading for a strong breakout upwards and retesting it, forming the right shoulder.
We have a bounce from the lower channel line to the right shoulder, which is support at 0.620.
We have a d

#SUSHI/USDT#SUSHI
The price is moving within a descending channel on the 1-hour frame and is expected to break and continue upward.
We have a trend to stabilize above the 100 moving average once again.
We have a downtrend on the RSI indicator, which supports the upward move by breaking it upward.
We have a

Sushi bullish again wait for bullish breakout Sushi bullish again wait for bullish breakout
.
.
.
.
.

SUSHIUSDT 1W AnalysisSUSHI ~ 1W Analysis
#SUSHI This is the lowest support for now, buy from here with a short term target of at least 15%+ from here.

Is SUSHIUSDT About to Bounce or Break? Yello, Paradisers! SUSHIUSDT is setting up an intriguing scenario after reacting to a key resistance trendline. Let’s break this down:
💎If SUSHIUSDT shows a bullish I-CHoCH (Internal Change of Character) from the key support zone—previously a resistance level—it could signal a higher probability of

SUSHIUSDT 1D#SUSHI is moving inside a Descending Broadening Wedge pattern on the daily chart. It’s holding above the daily MA100, which is a bullish sign, and it's on the verge of breaking out above the pattern. In case of a breakout, the targets are:
🎯 $0.977
🎯 $1.302
🎯 $1.566
🎯 $1.829
🎯 $2.203
⚠️ Use a tigh

SUSHI Token: A High-Potential Setup You Shouldn’t IgnoreHello everyone!
A huge opportunity has emerged on the BINANCE:SUSHIUSDT chart. I’ll break down the technical analysis for SUSHI using both the Daily and 4H timeframes , highlighting key levels and potential trade setups.
On 1D timeframe
- Price has swept the liquidity below the November

See all ideas
Summarizing what the indicators are suggesting.
Oscillators
Neutral
SellBuy
Strong sellStrong buy
Strong sellSellNeutralBuyStrong buy
Oscillators
Neutral
SellBuy
Strong sellStrong buy
Strong sellSellNeutralBuyStrong buy
Summary
Neutral
SellBuy
Strong sellStrong buy
Strong sellSellNeutralBuyStrong buy
Summary
Neutral
SellBuy
Strong sellStrong buy
Strong sellSellNeutralBuyStrong buy
Summary
Neutral
SellBuy
Strong sellStrong buy
Strong sellSellNeutralBuyStrong buy
Moving Averages
Neutral
SellBuy
Strong sellStrong buy
Strong sellSellNeutralBuyStrong buy
Moving Averages
Neutral
SellBuy
Strong sellStrong buy
Strong sellSellNeutralBuyStrong buy
Displays a symbol's price movements over previous years to identify recurring trends.