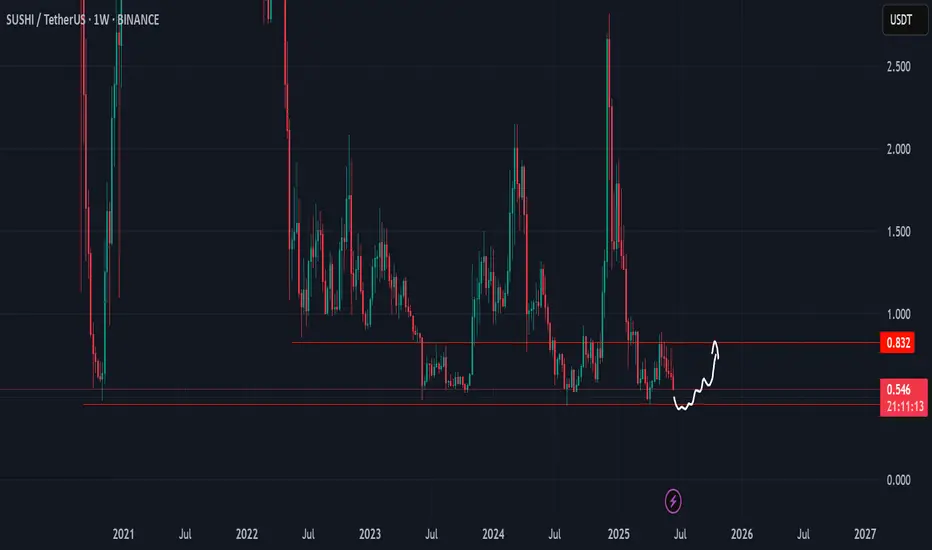
Massive Upside for SUSHI from Key Demand Zone!CRYPTOCAP:SUSHI is bouncing strongly from a key multi-tested weekly support zone (~$0.42–$0.55), signaling a potential bottom formation. Price action shows a bullish structure with the possibility of a trend reversal. If momentum continues, we could see a rally first toward Resistance 1 at $1.25, f
Related pairs

$SUSHI Flips Resistance into Support, Next Leg Loading?CRYPTOCAP:SUSHI Long Setup
Breakout from the Expanding channel on strong volume✅
Now flipping resistance into support, an ideal retest zone is forming.
Entry: 0.69 – 0.72
Stop Loss: 0.64
Targets:
TP1: 0.88
TP2: 1.11
Looks like momentum is building; watching for continuation after retest 🔥
DYOR |

SUSHI/USDT Reversal from Historical Demand ZoneThe SUSHI/USDT pair is showing strong potential for a bullish reversal from the long-term demand zone between $0.44 - $0.58, which has historically acted as a solid support area since 2021. Price has tested this zone multiple times and has bounced back, indicating significant buying interest.
🔍 Tec

SUSHI Nice Structure, Keep in WatchlistSushi has nice price structure
0.4 is good buying opportunity
#SUSHI/USDT#SUSHI
The price is moving in a head and shoulders pattern on the 1-hour frame, adhering well to it, and is heading for a strong breakout upwards and retesting it, forming the right shoulder.
We have a bounce from the lower channel line to the right shoulder, which is support at 0.620.
We have a d

#SUSHI/USDT#SUSHI
The price is moving within a descending channel on the 1-hour frame and is expected to break and continue upward.
We have a trend to stabilize above the 100 moving average once again.
We have a downtrend on the RSI indicator, which supports the upward move by breaking it upward.
We have a

Sushiswap 1,2 Breakout Sequence Can Lead To New ATH (3,000% PP)On this chart and after reaching a market bottom Sushiswap produced a clear 1,2 breakout sequence. This sequence has been shown to produce a bullish wave.
You know what they say, "Third time's a charm," and we are on the third breakout from a long-term support.
1) In early June 2023 we have the fi

Sushi bullish again wait for bullish breakout Sushi bullish again wait for bullish breakout
.
.
.
.
.

SUSHIUSDT 1W AnalysisSUSHI ~ 1W Analysis
#SUSHI This is the lowest support for now, buy from here with a short term target of at least 15%+ from here.

Is SUSHIUSDT About to Bounce or Break? Yello, Paradisers! SUSHIUSDT is setting up an intriguing scenario after reacting to a key resistance trendline. Let’s break this down:
💎If SUSHIUSDT shows a bullish I-CHoCH (Internal Change of Character) from the key support zone—previously a resistance level—it could signal a higher probability of

See all ideas
Summarizing what the indicators are suggesting.
Oscillators
Neutral
SellBuy
Strong sellStrong buy
Strong sellSellNeutralBuyStrong buy
Oscillators
Neutral
SellBuy
Strong sellStrong buy
Strong sellSellNeutralBuyStrong buy
Summary
Neutral
SellBuy
Strong sellStrong buy
Strong sellSellNeutralBuyStrong buy
Summary
Neutral
SellBuy
Strong sellStrong buy
Strong sellSellNeutralBuyStrong buy
Summary
Neutral
SellBuy
Strong sellStrong buy
Strong sellSellNeutralBuyStrong buy
Moving Averages
Neutral
SellBuy
Strong sellStrong buy
Strong sellSellNeutralBuyStrong buy
Moving Averages
Neutral
SellBuy
Strong sellStrong buy
Strong sellSellNeutralBuyStrong buy
Displays a symbol's price movements over previous years to identify recurring trends.
Frequently Asked Questions
The current price of SUSHI/USD TETHER (SUSHI) is 0.727 USDT — it has risen 4.76% in the past 24 hours. Try placing this info into the context by checking out what coins are also gaining and losing at the moment and seeing SUSHI price chart.
SUSHI/USD TETHER price has risen by 23.39% over the last week, its month performance shows a 16.85% increase, and as for the last year, SUSHI/USD TETHER has increased by 6.13%. See more dynamics on SUSHI price chart.
Keep track of coins' changes with our Crypto Coins Heatmap.
Keep track of coins' changes with our Crypto Coins Heatmap.
SUSHI/USD TETHER (SUSHI) reached its highest price on Dec 9, 2024 — it amounted to 2.814 USDT. Find more insights on the SUSHI price chart.
See the list of crypto gainers and choose what best fits your strategy.
See the list of crypto gainers and choose what best fits your strategy.
SUSHI/USD TETHER (SUSHI) reached the lowest price of 0.446 USDT on Aug 5, 2024. View more SUSHI/USD TETHER dynamics on the price chart.
See the list of crypto losers to find unexpected opportunities.
See the list of crypto losers to find unexpected opportunities.
The safest choice when buying SUSHI is to go to a well-known crypto exchange. Some of the popular names are Binance, Coinbase, Kraken. But you'll have to find a reliable broker and create an account first. You can trade SUSHI right from TradingView charts — just choose a broker and connect to your account.
Crypto markets are famous for their volatility, so one should study all the available stats before adding crypto assets to their portfolio. Very often it's technical analysis that comes in handy. We prepared technical ratings for SUSHI/USD TETHER (SUSHI): today its technical analysis shows the buy signal, and according to the 1 week rating SUSHI shows the neutral signal. And you'd better dig deeper and study 1 month rating too — it's neutral. Find inspiration in SUSHI/USD TETHER trading ideas and keep track of what's moving crypto markets with our crypto news feed.
SUSHI/USD TETHER (SUSHI) is just as reliable as any other crypto asset — this corner of the world market is highly volatile. Today, for instance, SUSHI/USD TETHER is estimated as 7.62% volatile. The only thing it means is that you must prepare and examine all available information before making a decision. And if you're not sure about SUSHI/USD TETHER, you can find more inspiration in our curated watchlists.
You can discuss SUSHI/USD TETHER (SUSHI) with other users in our public chats, Minds or in the comments to Ideas.