SUSHI break-outSUSHI formed a triple bottom pattern (in 4H TF). It'd already broken out the neckline and now is going up.
SUSHIUSDT trade ideas

Sushi (SUSHI) - July 21hello?
Welcome, traders.
By "following", you can always get new information quickly.
Please also click "Like".
Have a good day.
-------------------------------------
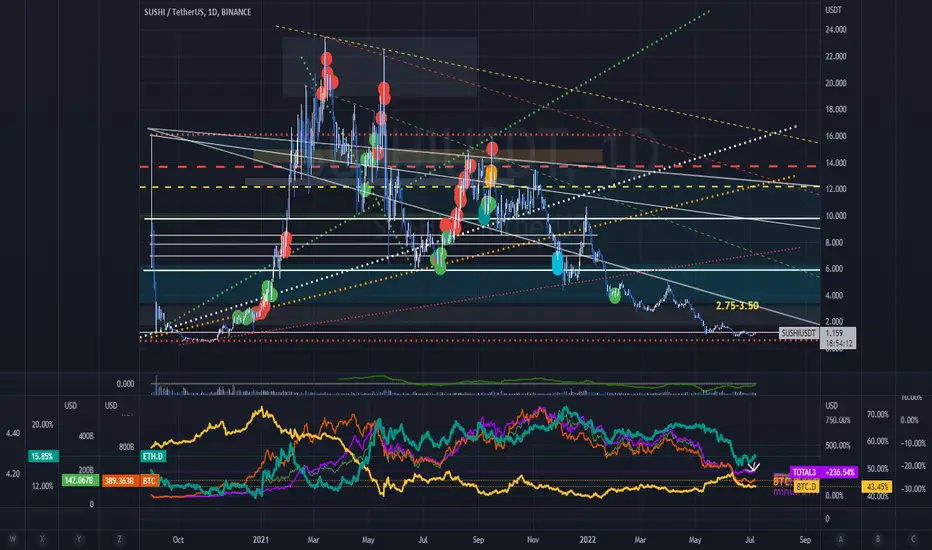
(SUSHIUSDT 1W Chart)
Whether it can move higher than 2.793 is the key.
Failure to move above 1.578 is expected to lead to further declines.
(1D chart)
The key is whether it can rise above the 1.417-1.578 section.
If it goes down, we should see if there is support near 1.002.
- As the RSI and Stoch RSI indicators fell in the oversold section, there is a possibility of a short-term decline.
- At this time, it is necessary to check whether the price can be maintained near the 60 SMA line.
If it doesn't, there is a possibility that it will fall near the lower line of the bollinger bands.
------------------------------------------------------------ -------------------------------------------
** All indicators are lagging indicators.
Therefore, it is important to be aware that the indicator moves accordingly as price and volume move.
However, for the sake of convenience, we are talking in reverse for the interpretation of the indicator.
** The MRHAB-T indicator used in the chart is an indicator of our channel that has not been released yet.
** The OBV indicator was re-created by applying a formula to the DepthHouse Trading indicator, an indicator disclosed by oh92. (Thanks for this.)
** Support or resistance is based on the closing price of the 1D chart.
** All descriptions are for reference only and do not guarantee a profit or loss in investment.
(Short-term Stop Loss can be said to be a point where profit and loss can be preserved or additional entry can be made through split trading. It is a short-term investment perspective.)
---------------------------------

SUSHI could have a little bullish momentum - Crpyptoz18❶ Warning
Operations in the Blockchain or FX market represent a high risk. Cryptoz18 is a content creator who posts his ideas for viewers however he never provides an investment recommendation. I recommend to the reader a good risk management and knowledge regarding the environment. Thank you very much.
❷ Tutorials
➤ Here you can find a brief explanation of how the operations work in case you are interested in following them.
➤ Here you can find an explanation of how to track our ideas:
✔️ Our operations are taken with StopLoss and Take Profit of 15 minutes. However, we are looking to try and catch a 4H trend. So, once we touch the TPM according to your own analysis you should consider whether to close the trade or move StopLoss to entry.
❸ Operational Information
• Entry price: 1.472
• StopLoss: 1.414 (Loss 3.94%)
• TakeProfit Minimum: 1.521 (Win 3.33%)
• Recommended margin: 5% of the Futures account
• Recommended leverage: 1x.
• Temporality: 15Min - 4H

Sushi Breakout? Another long signal for a quick scalp. Will let half run if we can see a breakout here.

SUSHI (watching for possible breakout)SUSHI / USDT
The altcoins market has pumped thanks to ETH as expected in previous idea
Today we watching some of interesting altcoins ,
SUSHI is an example
We watching a confluence between horizon resistance and trend resistance
Once Breakout is confirmed strong bullish will be followed , so keep your eye on it !
Best of wishes

SUSHI - Early signs of trend reversalHi,
Indicators are telling me that the price action on SUSHI might reverse soon.
Based 4D and 2D TF i expect the price action to fall back down to $1 level.
Let's wait for the perfect entry!
======
Click like and make sure you are following me on TradingView!
Feel free to ask me any questions related to the idea in the comment section - i'll be glad to reply.
Good Luck, Bye-bye!
And remember this market doesn't respect doubters!
======
***
Chart Code:
Pastel Green Vertical Line - Long Signal (PAI Reader Strategy)
Pastel Red Vertical Line - Short Signal (PAI Reader Strategy)
Red Dashed Lines - Downward Reversal Momentum
Green Dashed Lines - Upward Reversal Momentum
Green Rectangle - Buying Area
Red Rectangle - Selling Area
Red Line - Stop Loss
Bold Aqua Dotted Line - Estimate Price Direction
Yellow Dotted Lines - Estimate Timerange of the price target might be getting hit
Orange Dotted Line - Profit taking Point
***

A Few Possible Buy-In Spots for $SUSHI I'm long on SUSHI & have been the last few weeks, after all the inverse fibonacci's had bottomed out & the price became pressed against that massive diagonal trend line. This chart is a 4hr chart, & I believe we're just essentially in consolidation before a move up. These are some possible targets where the price might dip to, barring a big sudden move up without further consolidation. We've got a cypher pattern in play & a couple fibonacci retracement possibilities.
*Not trading advice.

SUSHIUSDTI think it is very bullish, or do you have the same opinion!?!?!
If the corrective movement trend does not fall below the price range of $0.918, the possibility of forming an upward trend similar to the drawn scenario is not at all out of mind.
On the other hand, Ethereum and Bitcoin have not yet issued a signal for an upward trend!!!
As long as the loss limit is met, you can make a trade worth the risk and reward.
We would be very happy to hear your comments

Sushiswap W Pattern (50% Target Mapped)I've shared so many of these that I am hoping that you already know all these signals by memory.
They work nicely yet it isn't just the signals but the market cycle together with experience that produces the best results.
You can find the target with the drawn pattern on the chart.
The RSI is strong.
We have increasing volume.
Trading above the EMAs...
And so on...
One more chart and for today we are done.
I hope you find this information useful.
Thanks a lot for the continued support.
Namaste.

SUSHIUSDT | Wave Projection Uptrend target | Reversal PatternPrice action and chart pattern trading
> Wave projection ABC sideway uptrend with reversal pattern breaking out SMA50 resistance zone
> Target @ upper main channel resistance zone if breakout SMA50
Indicator:
> RSI TF4H breakout MA line above 60
> MACD golden cross above baseline
> Supertrend pivot point reversal for uptrend
> CDC action zone uptrend ribbon continuation
Always trade with affordable risk and respect your stoploss

SUSHI trending on H4 in play - Cryptoz18█ Operation Information
SUSHI currently its trend in 4H is in play if bitcoin manages to maintain its lateral value or falls directly sushi probably has a downward pullback. If it breaks upwards, sushi will probably invalidate our position.
█ Operation data
• Entry price: 1.221
• StopLoss: 1.266 (Loss 3.69%)
• TakeProfit Minimum: 1.164 (Win 3.52%)
• Recommended margin: 5% of the Futures account
• Recommended leverage: 1x.
• Temporality: 15Min - 4H
✔️ Data: The user is recommended to move the StopLoss to entry once we reach the TPM or also known as the Minimum TakeProfit.
In this way, if the trend is good for a longer timeframe, it will never touch the StopLoss placed on our entry. We will only have to pay the commissions in case we get the SL at the entrance.
Being a 15-minute trade looking to take a 4H trend it is likely to have a fairly low Winrate due to the tight StopLoss however this offers us better risk management. We try to take a 4H trend using SL and TPM of 15 minutes.
This way, we seek to obtain a profit of 100% between all operations. Only 5% of the account per operation could achieve our objective and thus obtain a return of 5-7% per month of the total account. This will be reflected at the top of our profile.
]█ Explanation of how the operations work:
Here you can find a brief explanation of how the operations work in case you are interested in following them.
█ Warning
✔️ Blockchain or FX operations represent a high risk. Therefore, this operation should not be taken as an investment recommendation. All I do is share my trade ideas publicly for the viewer to do their own analysis and decide to enter based on her own decision making. The viewer is recommended to have good risk management in their operations. To do this, take into account the fundamental data of Asset Volume, Market Capitalization, Supply, Percentage Change Price, Current Volatility, Perpetual Data, and lastly, proper Margin and Leverage management. Be careful, you can lose all your money in the future if they have poor risk management. Nothing more to say thank you very much.

SUSHIUSDTPERPDue to the weakened upward trend in the chart, we see a reversal by reaching the resistance, which is expected to see a price drop until the bottom of the support area.

SUSHIUSDTHey Guys :)
This is my monthly Analysis OF #SUSHIUSDT...
My first Target have Good RR(2.3)
Risk free on all Target...
Take care Guys :) :*

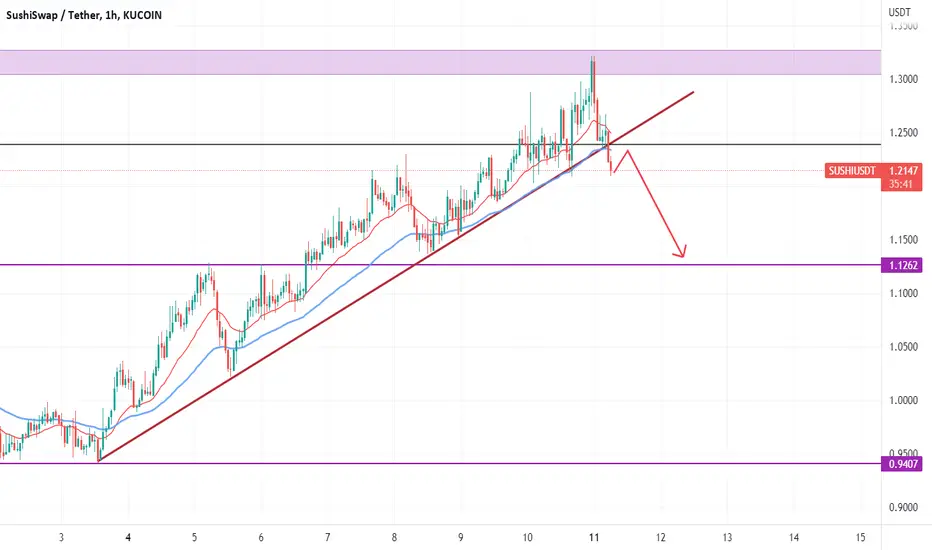
sushu usdt 1h chart short setupsushu usdt 1h chart short setup
sushi break the ascending trend line and monthly pivot with good momentum , next support at 1.13
not financial advice
500% for SUSHIIf trendline breaks, it is very possible, long term trade... manage your risk
not financial advice

SUSHIUSDT | BEARISH SIGNSSUSHIUSDT has approached to resistance area where once again selling pressure is expected to come. Currently price action has slow down with long wick candles and bearish divergence on RSI .
The break of rising support will give complete control to bears. The price action above horizontal resistance will favors bulls.
Trade your levels accordingly.

SUSHI - WHAT?Hey Guys, SUSHI looks like it will outperform BTC. Looks super strong! I`m in with a little trade, but HIGH RISK!!!! Maybe better Spot!
NO FINANCIAL ADVICE | HAPPY TRADING | DYOR | JUST MY THOUGHTS

A buy position for sushiWe expect the price to reach the resistance level and fall there , If you see a reversal pattern, you can take a sell position at the resistance level

SUSHI is ready to fly 🚀Hello traders 🐺 .
in today idea , I want to talk about SUSHI chart and have quick look at the future perspective of the SUSHI price and see what gonna happen for the SUSHI , so make sure that reading this idea until to the end 👇 :
As you can see in the chart above , we have a very big falling wedge pattern which is a bullish pattern and the target of this pattern is the top of the wedge , in this case target is near to the all time high price .
Also I found some interesting fact in the chart so I decided to share them with you :
First of all let's start with the RSI :
In the chart above we can see that the RSI is also is in the same pattern just like a price and the interesting fact is that , RSI had never been as low as the current level around the oversold territory which could indicate that SUSHI found the bottom , and it's time to break above .
the second one is MACD :
In the MACD we have 2 important sign :
(A) _ MACD line is crossing above the signal line which usually consider as a buy signal
(B) _ we have a very clear bullish divergence between the MACD and the price
This two sign together could showing us a very strong buy signal
third one is stochastic :
about the stochastic we can see that a buy signal and more importantly if you look back into the history of the price , every time that stochastic was around the current level and flashed a buy signal we saw a nice bullish impulse in the price .
I hope you enjoyed this idea , Also if you are interested in my ideas make sure to follow me and share my ideas among your friends ; thank you for reading my idea 🙏🐺 .

sushi usdt daily chart sushi usdt daily chart
falling wedge break from upside and price reach the monthly pivot and if sushi break this pivot , it can continue upward
2 different idea shown by red and green arrow
also its depend on btc so before taking financial Decision attention btc

sushi under 1.00/1.25 even 1.50 is a buy n forget at the least1.75/1.85 is the first of what you could call resistance with the real first target of 2.75/2.85 or in other words Sushi under or close to 1usd is redonkuless and a def scoop and forget. We have utility and liquidity with an actual team running this project. at this point Uniswap is almost to mainstream as far as Dexs go or decentralized exchanges and I worry a major target for USA etc regulations and ruthless acquisition attempts to hold majority tokens in pools and eventually the asset it self as a whole. anyway road this b!tch to 20usd from about here last time so lets go. cosmos integration with cross chain movement options and hopefully continue to build out new exit and on ramps for fiat into and off crypto
SUSHI - Delicious! 😤Reasons to take long:
⭐️ BTC needs a pullback
⭐️ Level is 8 days long
⭐️ Level is clean
⭐️ Price is squeezing to the level
⭐️ Pullbacks are getting smaller
⭐️ 3rd touch
⭐️ 50 ATR
⭐️ Over VWAP
Will enter when price squeezes to the level on 5m timeframe, the base will form and the tape will get faster.
If you don't understand the previous sentence, just use swing stop-loss 3-5%
Fix profit by parts:
1% - 1/3
2% - 1/3, stoploss to breakeven
What's left, hold to the maximum
What do you think of this idea? What is your opinion? Share it in the comments📄🖌
If you like the idea, please give it a like. This is the best "Thank you!" for the author 😊
P.S. Always do your own analysis before a trade. Put a stop loss. Fix profit in parts. Withdraw profits in fiat and reward yourself and your loved ones

Sushi/USDT long📈Previous important support and resistance zones:
*s1: 0.920
*s2: 1.113
*r1: 1.298
Conditions for long:
1.break of trend line
2.break of descending triangle breakout
3.break from momentum indicator trendline
4.resistance from the previous *s1: 0.920 zone
5.volatility increased
6.Money flow index turned green from red
7.di+ is above the di-
8.adx line is above the 20 level
Stoploss:
1.below the previous *s1: 0.920 zone
Take profit:
1.I like to trail the take profit but *s2: 1.113 zone can be next take profit because it was previous support zone then turned into a resistance zone
