sushi longi'd probably buy half here and hald at 1.42.
invalidation if 4h candle closes below trendline.sell at above targets
SUSHIUST trade ideas

#SUSHI/USDT 4HR CHART UPDATE !!
Hello, traders welcome to another ALT COIN chart update.
As we can see at the above mentioned chart that SUSHI/USDT formed an inverse HEAD & SHOULDER pattern and it broke the neck line.
Now, we can take entry at cap and add more, some % below the current price level for almost 100% profit in upcoming weeks.
Entry:-$1.54, $1.5
Target:-100%
Stop-loss:-$1.380
NOTE: This is not financial advice. This is for education purposes only. I am not responsible for the profits or losses you generate from your investments.
DO YOUR RESEARCH BEFORE MAKING ANY TRADES.
Thank you.

SUSHI, oscillating upward trend.The following content is machine translation:
In the 4-hour chart, the lowest point fell to $1.082 on May 12, which was the lowest point since November 26, 2020, and then began to fluctuate slightly upwards. The low point was pulled back from the upward oscillating trend to form a rising trend line, which is also support. The line has been on the trend line from May 12 to now, and it is expected to continue to rise in this way in the future.
On the indicator, the fast and slow line of the macd indicator is on an upward trend. It is currently sprinting towards the zero axis at a point below the zero axis, and it is expected to accelerate the rise if it rushes up. The RSI indicator is currently operating at neutral 50, which is bullish.
In operation, the market runs along the upward trend line, the indicator is in line with the bullish trend, go long, and effectively fall below the downward trend line and stop loss, with a target of $1.8 or $2.

$SUSHI - Double TopHello everyone!
SUSHIUSDT might continue the downside move from here if closes below 1.59
Best of luck with your trades!

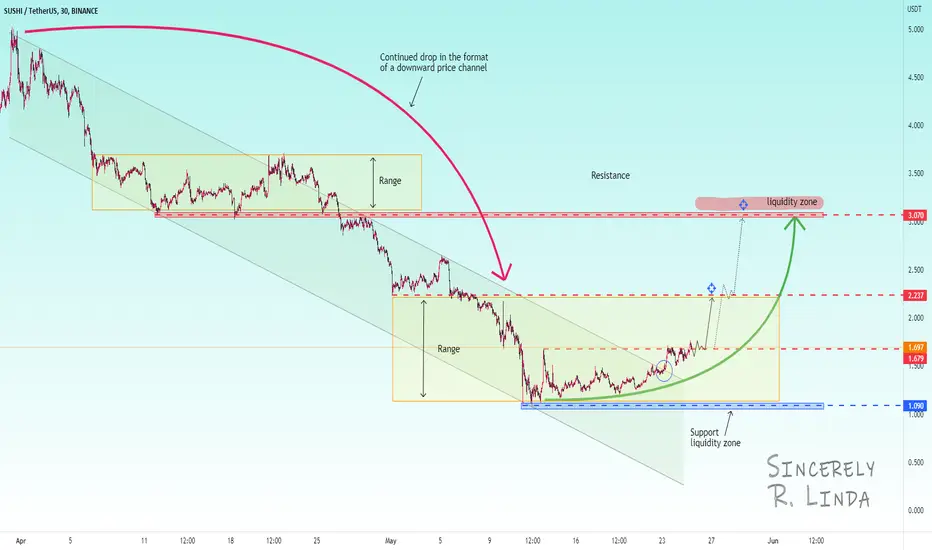
SUSHIUSDT ! Breakdown of the descending channelSUSHIUSDT drops by 78% from its maximum value of 5.000 and stops at the support of 1.09. After a long consolidation, the cryptocoin starts to tighten up against the resistance of the downward channel. After testing, the price does not fall, returns after pre-breakout consolidation to a close retest and breaks through,
thus breaking the downstream channel.
Coin in the range between 1.679 and 1.09. The resistance level has been broken. I assume that the price will fix above the upper limit of the range with subsequent growth. The potential is big. In the short term, I expect growth to resistance 2.237, and in the medium term to 3.07
Sincerely, R. Linda!
SUSHI/USDT 1D CHART UPDATE!!Hello, community members welcome to this SUSHI/USDT 1D chart update.
Don’t forget to hit the like button if you find this update helpful because this motivates me to bring this kind of update on a regular basis.
Now, Let's get to the chart,
As we can see from the above-mentioned chart that SUSHI/USDT currently trading below the mid-trend line of this parallel channel pattern.
If sushi follows the previous rally then from here sushi can pump towards the upper trend line and we can gain almost 50% profit.
Sushi must break above this mid-trend line and retest to move upside.
TRADE SETUP
Entry - $1.63 - $1.70
Target - 40% - 50%
Hold on spot or use leverage 5x - 10x
SL - $1.55
NOTE: This is not financial advice. This is for education purposes only. I am not responsible for the profits or losses you generate from your investments.
DO YOUR OWN RESEARCH BEFORE TAKING ANY TRADES.
Thank you

SUSHI/USDT BUYING SETUPSUSHI Valid retest after breakout ascending triangle pattern. in correction retest make a Bullish pennant continuation pattern to bullish movement and also succeed breakout we can setup entry now or when retest
Buy zone : 1.7 - 1.6 - 1.5
Target : 1.841 - 1.841 - 2.238 - 2.594
Stop : 1.45

#SUSHI/USDT 1DAY UPDATE BY CRYPTOSANDERS !!Welcome to this quick SUSHI/USDT analysis.
I have tried my best to bring the best possible outcome in this chart.
Reason of trade:- SUSHI/USDT PARALLEL CHANNEL brake the green and trandline and buy the retest green zone. PARALLEL CHANNEL green zone. (SPOT CALL)
Entry:-$1.24,$1.49
Traget:- 100%
Stoploss:- $1.080
Remember:-This is not a piece of financial advice. All investment made by me is at my own risk and I am held responsible for my own profit and losses. So, do your own research before investing in this trade.
Sorry for my English it is not my native language.
Do hit the like button if you like it and share your charts in the comments section.
Thank you...

💡Don't miss the great buy opportunity in SUSHIUSD @SushiSwapTrading suggestion:
". There is a possibility of temporary retracement to the suggested support line (1.504 ).
. if so, traders can set orders based on Price Action and expect to reach short-term targets."
Technical analysis:
. SUSHIUSD is in a range bound, and the beginning of an uptrend is expected.
. The price is below the 21-Day WEMA, which acts as a dynamic resistance.
. The RSI is at 74.
Take Profits:
TP1= @ 1.708
TP2= @ 1.815
TP3= @ 1.979
TP4= @ 2.173
TP5= @ 2.323
SL= Break below S2
❤️ If you find this helpful and want more FREE forecasts in TradingView
. . . . . Please show your support back,
. . . . . . . . Hit the 👍 LIKE button,
. . . . . . . . . . Drop some feedback below in the comment!
❤️ Your support is very much 🙏 appreciated!❤️
💎 Want us to help you become a better Forex / Crypto trader?
Now, It's your turn!
Be sure to leave a comment; let us know how you see this opportunity and forecast.
Trade well, ❤️
ForecastCity English Support Team ❤️

💡Don't miss the great buy opportunity in SUSHIUSD @SushiSwapTrading suggestion:
". There is a possibility of temporary retracement to the suggested support line (1.504 ).
. if so, traders can set orders based on Price Action and expect to reach short-term targets."
Technical analysis:
. SUSHIUSD is in a range bound, and the beginning of an uptrend is expected.
. The price is below the 21-Day WEMA, which acts as a dynamic resistance.
. The RSI is at 74.
Take Profits:
TP1= @ 1.708
TP2= @ 1.815
TP3= @ 1.979
TP4= @ 2.173
TP5= @ 2.323
SL= Break below S2
❤️ If you find this helpful and want more FREE forecasts in TradingView
. . . . . Please show your support back,
. . . . . . . . Hit the 👍 LIKE button,
. . . . . . . . . . Drop some feedback below in the comment!
❤️ Your support is very much 🙏 appreciated! ❤️
💎 Want us to help you become a better Forex / Crypto trader ?
Now, It's your turn !
Be sure to leave a comment; let us know how you see this opportunity and forecast.
Trade well, ❤️
ForecastCity English Support Team ❤️

SUSHI/USDT Is readyGood morning everyone,
Our attention caught SUSHI coin. It's lower-lows and lower-highs are getting very tight. We are expecting it to have a major correction soon where price should reach $4.70.
Stoploss is necessary !!
If you like ideas provided by our team you can show us your support by liking and commenting.
Yours Sincerely,
Swallow Team
Disclamer:
We are not financial advisors. The content that we share on this website are for educational purposes and are our own personal opinions.

SUSHI $1.64 ,$1.96 as targetsSUSHI looks good for opening a long position. I will enter when we se a rise in momentum( expansion of BBANDS )

Sushi Swap - monthly Gravestone DOJIWhy bearish? A few reasons:
1) Price action prints a lower high.
2) Price action is in a descending channel.
3) RSI support was broken around mid-March and now appears to be acting as resistance.
4) The monthly chart below printed a very convincing Gravestone DOJI candle.
5) Lastly, since being long, price action has returned a massive 4500% increase.
A sell from $18 is great
Target? $6.10

sushi/usdtSUSHI / USDT
It is in a bearish channel and has reacted to the $ 1 support below the channel.
The price is expected to rise in the range of $ 2 and then start falling from that area.
#sushi #BTC #ETH #LUNA #UST #DOGE

SUSHI, bullish pattern.The following content is machine translation:
SUSHI, forming a bullish pattern.
On the daily chart, the real Yang on the 21st cooperated with the doji inoculation line yesterday and rose today, forming a bullish pattern. The macd indicator completed the golden fork, with the upper resistance level at 1.8 or 2, near the target resistance level.
SUSHI, bullish pattern.

Sushi triangle breakoutA lot of coins are setting up like this and after 7 weeks of red, I think the triangle will break out upward. The indicators are in a uptrend weighing more in favor of an upward move.

SUSHIUSDT - A way up to $2Hi,
This is iJustCoin, the one lucky trader who puts his money where his mouth is!
SUSHI price action is about to reverse upwards. I expect the price action to touch the resistance at $2 level.
On my opinion price will fall down to the green rectangle area as a SPRING/TEST event in what is looking like accumulation phase at the moment.
This is will be a 50% move up , i expect it to take about 1-2 weeks.
I'll be updating that idea providing the best moment for entry.
Click like and make sure you are following me on TradingView!
Feel free to ask me any questions related to the idea in the comment section - i'll be glad to reply.
Good Luck, Bye-bye!
And remember this market doesn't respect doubters!
***
Chart Code:
Pastel Green Vertical Line - Long Signal (PAI Reader Strategy)
Pastel Red Vertical Line - Short Signal (PAI Reader Strategy)
Red Dashed Lines - Downward Reversal Momentum
Green Dashed Lines - Upward Reversal Momentum
Green Rectangle - Buying Area
Red Rectangle - Selling Area
Red Line - Stop Loss
Bold Aqua Dotted Line - Estimate Price Direction
Yellow Dotted Lines - Estimate Timerange of the price target might be getting hit
Orange Dotted Line - Profit taking Point
***

Sushi Weekly Falling Wedge Since March 2021 to the present, Sushi has surrendered 95% of its value.
On the weekly chart of Sushi we keep seeing Lower Highs and Lower Lows which has brought the price into a big falling Wedge.
Look for bottoming patterns, bullish divergence etc. on the lower timeframes for the best entry or choose DCA.
As long as BTC can keep the Weekly 28570 support, I will remain bullish for sushi.

💂🏻CryptoSoldier💂🏻: BUY SUSHISWAP
📈 Spot Trade: BUY SUSHISWAP
⚠️ SL: -
🏅 TP: -
⏳ Time aprox: 7~10 dias
💂🏻If you agree this Trade hit the like button.
💂🏻Si estas de acuerdo deja tu like.

SUSHI LONG#SUSHIUSDT
$SUSHI looks ready to move. Building position here.
TP - $4.3, $5.0 , $5.8
SL ❌ $3.45
Leverage x5 (Risk takers only)

sushi daily market shows a bull trap in opinion. why ?
in weekly time frame all the bearish signals can be seen . then we are in a daily correction . if this patterns happen you will hear some nonsense news after the crash of market. buy there and wait good news will come too. in my strategy time is more important than price and according to the trends i believe the low price must be in Feb. i will update my post if i feel any change .

beautiful flagSushi has a low risk to reward ratio at this price.
Fibo extension levels:
1 (1-a-b)=$4
1 (C-1-c)=$196

SUSHI USDT To 2.8 $$$Sushi Usdt To 2.8 $$$
Sushi Usdt To 2.8 $$$
SUSHI USDT To 2.8 $$S
Sushi Near 2.1
