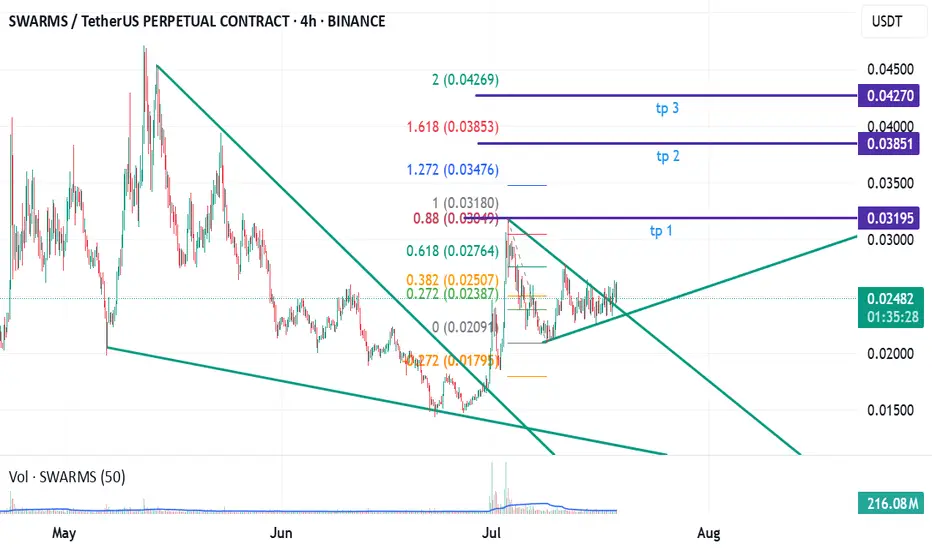
swarms is COMING! continuation triangle breakoutafter breakout from falling wedge, the continuation pattern is forming symmetrical triangle in the past 1 month.
today is the day, he is just breakout from symmetrical triangle.
watch out for the pump.
may do a retest on saturday.
try to seek for entry when market is low volume if have minor pullb
Related pairs
SWARMSUSDT.P - LONG RecommendationSWARMSUSDT.P - LONG Recommendation
Peak Tracking: Daily timeframe (D1)
Entry: Around current price: $0.02425
Fixed Target: $0.045 or follow D1 peak signals to exit positions.
Reasoning: The D1 timeframe correction has completed, signaling potential for a new peak.
Strategy: Enter position in

SWARMS | High Risk Microcap PlayThe AI agent token SWARMS presents a compelling bullish opportunity after breaking above its long-term descending trendline.
Entry Options:
Option 1: Aggressive entry on trendline break confirmation around $0.027
Option 2: Conservative entry on pullback to green support zone near $0.02
Targets &

SWARMS/USDT buy setupAfter a prolonged downtrend since its listing on Binance, SWARM/USDT has dropped over 97%, forming a long accumulation base. The price has now broken out of the daily trendline, signaling a potential trend reversal.
Entry Zone (DCA): Green Box
Breakout Confirmation: Daily trendline breakout
Potent

SWARM superbAfter our Fbuy swarm is riding the up ladder with good volume
Next stop area would be in 0.026-0.028 area. As it's ATL coin, there's surprise ahead
For indicator access, you can contact me
Have a great day
Remember DYOR

SWARMSUSDT 1D AnalysisSWARMS ~ 1D Analysis
#SWARMS , This trade is very high risk. Buy here with a short term target of at least 20%+ from this lowest support.

buying swarms ai herebuying swarms here it could get stopped out and dip to 0.03174 but will just buy again, coin i down 90% so i think is a good time to buy of course NFA. do your on TA
SWARMSUSDT 1D Analysis SWARMS ~ 1D Analysis
#SWARMS This trade is very high risk
Buy from here if you still have confidence in this coin with a short term target of at least 15%+ from here.

SWARMS Is Bulish (12H)A key flip zone on the SWARMS chart has been reclaimed.
The trigger line has been broken, and we have a bullish CH (Change of Character) on the chart.
As long as the flip zone holds, price may move toward the identified targets.
A daily candle close below the invalidation level would invalidate t

Swarms further dump to $0.02448 Swarmsusdt short
Target: $0.02448
Stop: $0.03 or higher
Roughly 2.5R
Expecting further drop as we approach weekly closure.

See all ideas
Summarizing what the indicators are suggesting.
Oscillators
Neutral
SellBuy
Strong sellStrong buy
Strong sellSellNeutralBuyStrong buy
Oscillators
Neutral
SellBuy
Strong sellStrong buy
Strong sellSellNeutralBuyStrong buy
Summary
Neutral
SellBuy
Strong sellStrong buy
Strong sellSellNeutralBuyStrong buy
Summary
Neutral
SellBuy
Strong sellStrong buy
Strong sellSellNeutralBuyStrong buy
Summary
Neutral
SellBuy
Strong sellStrong buy
Strong sellSellNeutralBuyStrong buy
Moving Averages
Neutral
SellBuy
Strong sellStrong buy
Strong sellSellNeutralBuyStrong buy
Moving Averages
Neutral
SellBuy
Strong sellStrong buy
Strong sellSellNeutralBuyStrong buy
Displays a symbol's price movements over previous years to identify recurring trends.
Frequently Asked Questions
The current price of swarms / Tether USD (SWARMS) is 0.02530 USDT — it hasn't changed in the past 24 hours. Try placing this info into the context by checking out what coins are also gaining and losing at the moment and seeing SWARMS price chart.
swarms / Tether USD price hasn't changed in a week, its month performance shows a 38.25% increase, and as for the last year, swarms / Tether USD has increased by 740.53%. See more dynamics on SWARMS price chart.
Keep track of coins' changes with our Crypto Coins Heatmap.
Keep track of coins' changes with our Crypto Coins Heatmap.
swarms / Tether USD (SWARMS) reached its highest price on Jan 11, 2025 — it amounted to 0.65498 USDT. Find more insights on the SWARMS price chart.
See the list of crypto gainers and choose what best fits your strategy.
See the list of crypto gainers and choose what best fits your strategy.
swarms / Tether USD (SWARMS) reached the lowest price of 0.00301 USDT on Dec 23, 2024. View more swarms / Tether USD dynamics on the price chart.
See the list of crypto losers to find unexpected opportunities.
See the list of crypto losers to find unexpected opportunities.
The safest choice when buying SWARMS is to go to a well-known crypto exchange. Some of the popular names are Binance, Coinbase, Kraken. But you'll have to find a reliable broker and create an account first. You can trade SWARMS right from TradingView charts — just choose a broker and connect to your account.
You can discuss swarms / Tether USD (SWARMS) with other users in our public chats, Minds or in the comments to Ideas.