One Good Trade: AAPL Setting Up For An AntiAfter a wedge pattern played out, we had a strong bearish push to the down side. Now we are setting up for our first pullback from this initial move. This is known as the anti pattern. Check my YouTube or my website for a better explanation of this pattern.
APC trade ideas

AAPL - Short Term Bear - Swing Trade
NASDAQ:AAPL
Here's the details of my trade Short on AAPL....
Daily Chart:
- QQE Signal Short
- Divergence on the RSI
- Cross down on the MACD
4hr Chart:
- QQE Signal Short
- Strong Divergence on the RSI
- Cross down on the MACD
Fundamental Support:
- PE Ratio overvalued at 42, historic PE ratio range 12-28 excl Covid 2020
- Buffet has cut Berkshire Hathaways stake in Apple by 60%
- 2 consecutive years of flat YoY revenue, with declines in Iphone, Wearables, Ipad, Mac offset by YoY growth in Services
- Flat YoY Revenue in USA, Asia Pac, and Japan, with declines in Greater China
- 2 consecutive years of YoY Net Income decline, EPS benefit from share buybacks of 1B since 2022
- Operating Margin improvement, however primarily driven by product mix (decline of core products and growth of services business)
Recent Developments & News
- Next significant economic data is ADP employment report Wed Jan 8th and Unemployment Rate Fri Jan 10th
- A lower or higher employment figure than forecast could move the market and is a potential risk to the short position if employment figures are positive
- However, inadvertently, higher employment figures will reduce the likelihood of FED rate cuts, offsetting some of the upside potential
Target:
- Previous ATH at 236 ~-5.5% from current price
- Stop: A break above $260
- Possible profit taking at 50 day moving average near $237-$238 range
- Previous declines ranged from 8-15 days to reach short term lows, estimating similar timeframe with a possible break of support line, retest, and further decline
Risks:
- The rollout of Apple Intelligence sparks strong Christmas sales and upgrade cycle for Iphone 16
- Investor optimism for Apple Intelligence drives continued buying in AAPL
- A bounce off support and continued move higher
Overall:
AAPL has rolled out Apple Intelligence in several major markets with some features still coming soon. It would be an understatement to say that the development, features, and rollout have be clumsy at best. Not only has the rollout and announcements been underwhelming, but Apple looks to be playing catchup with technology competitors have already well established in the market.
Apple continues to be a loved brand worldwide, and there's no denying the brand loyalty is still strong, however lagging technology, premium prices on their products, high PE/valuation with flat to declining revenue and profitability. Until Apple can either reclaim it's technological advantage by becoming a leader again in the market, or reposition it's product offering and pricing to drive demand, it's difficult fundamentally see why the stock is worth the PE with so many other companies in market with new innovation and growth potential comparatively.
This isn't to suggest Apple will collapse, but a correction technically and fundamentally is warranted near term with broader economic risks and technological missed expectations that could warrant lower prices.
My Position:
5 Put Options
$250 Strike, Current Price $252.20
Expiration Friday Jan 10th
Average Price is $2.00 a contract
Investment $1000
Target $10.00-$16.00 (8-14:1 Profit Loss Ratio)
Stop $1.00
Potential Loss -$500
Potential Gain $4000-$7000

BUY AAPL at current priceBuy Apple stock at the current price.
My entry $245
SL $240
TP $260
Trade with risk management.

$AAPL Top of Channel intersection with (0.618)Parallel channel intersecting with a long term negative 0.618 here (soon)

Apple Gunning for potential break to the upside
SKILLING:US100 : AAPL has been consolidating for the past 4 months and is likely to breach past the key resistance at 236.03 as resistance is likely to be weakened.


Apple appears to be in a bullish trend for the near future.We observe a similar pattern to what occurred previously with APPL. Additionally, the Dynamic RSI indicator suggests that Apple could rise further. Therefore, we are setting the buy zone at the blue level. For Apple, two take profit levels have been set, meaning the strategy involves selling 50% at the first take profit level. Should the price return to the buy zone, we plan to reinvest the 50% for the second take profit.

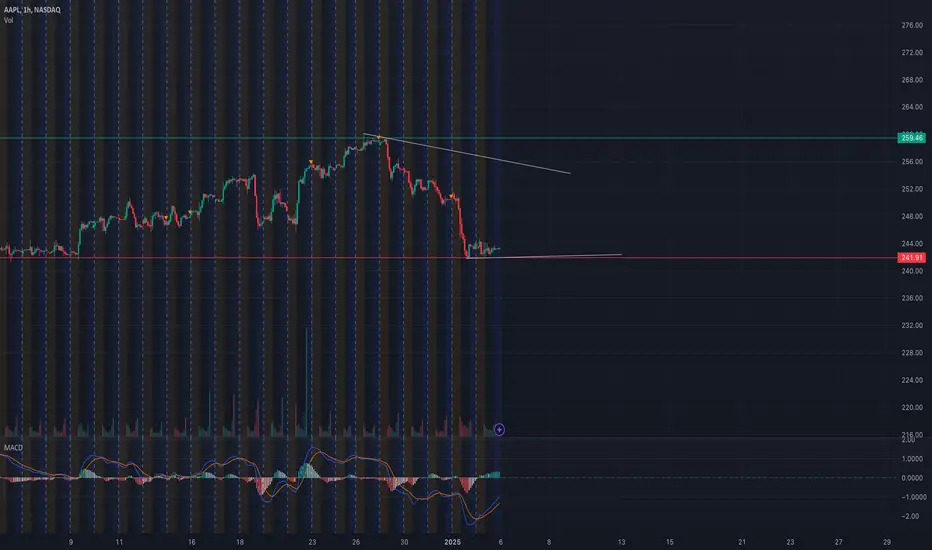
AAPL Hits a Critical Level! Prepare for Key Moves for Jan. 6Technical Analysis (AAPL - 1H Chart):
1. Price Action:
* AAPL is trading near the $243 range, showing signs of consolidation after a significant decline.
* The stock is testing critical support at $241, with immediate resistance at $247.5.
2. Trend Lines:
* Downward sloping trendline indicates ongoing bearish pressure.
* Break above $247.5 could signal a reversal, while a breakdown below $241 might trigger further downside.
3. Indicators:
* MACD: Slight bullish crossover, suggesting potential momentum shift to the upside.
* RSI: Neutral territory, indicating no immediate overbought or oversold conditions.
Gamma Exposure (GEX) and Options Analysis:
1. Key GEX Levels:
* Call Walls:
* $247.5 (24.19%) - Resistance where significant call activity is concentrated.
* $252.5 (8.01%) - Next resistance zone.
* Put Walls:
* $241 (Highest negative NET GEX / PUT Support) - Strong support zone.
* $237.5 (-11.48%) - Key downside level if $241 breaks.
2. IVR and Options Data:
* IVR: 38.2 (Moderate implied volatility rank).
* Put/Call Ratio: Higher PUT interest indicates cautious sentiment among traders.
Scenarios for Tomorrow:
1. Bullish Case:
* Break above $247.5 could trigger a rally toward $252.5.
* Entry at $247.5 with a target of $252.5, stop-loss at $244.
2. Bearish Case:
* Breakdown below $241 could lead to $237.5 or lower.
* Entry at $241 with a target of $237.5, stop-loss at $243.
Disclaimer:
This analysis is for educational purposes only and does not constitute financial advice. Please conduct your own research and consult with a financial advisor before trading.
Top 5 Weekly Trade Ideas #1 - AAPL LongAAPL flushed last week after breaking below its uptrend since April. It's a pretty bearish look, but I would expect a bounce if it retests the previous ATH around $237. Upside targets are the gap fill above, trendline above, and/or ATH.
If it doesn't hold, first downside targets are $230 and $216.

$AAPL long setting upThis is the weekly for $AAPL. It is in an uptrend, and I have drawn a Fibonacci retracement frame around recent minor swing low and swing high. An area I would look to get long for a 4-8 week tactical trade would be the Breakout-pullback area indicated by the green rectangle. The stop loss would be beneath the swing low where the retracement was drawn from and the take profit would be at the swing high. As a confluence, the breakout-pullback area is at the 50% retracement area. So a dip below 50% would represent price being in discount for an eventual move back to the swing high.

Apple (AAPL) Buy Signal - Bounce from Green Box Apple is approaching a key buy zone after completing a corrective wave (C). This could be a strong opportunity to enter for a potential move back up.
💡 Key Details:
Buy Zone: $233.68 - $240.10
Stop-Loss: Below $233.68
🎯 Targets:
Target 1: $250
Target 2: $260
🚨 What to Watch:
- Look for price action confirmation in the buy zone before entering.
- Use the stop-loss to manage risk if the setup doesn’t play out.
- This setup aligns with Fibonacci retracements and wave analysis, indicating a potential reversal soon.

Apple (AAPL): Testing Key Support—What’s Next? NASDAQ:AAPL
🔥 LucanInvestor’s Commands:
🩸 Resistance: $246.00. A breakout targets $250 and $256, signaling potential recovery.
🩸 Support: $243.00. A breakdown exposes $240 and $235 as critical levels for correction.
🔥 LucanInvestor’s Strategy:
🩸 Long: Above $246.00, aiming for $250 and $256. Look for increased volume to sustain momentum.
🩸 Short: Below $243.00, targeting $240 and $235. Bears could take control if the price breaks this level.
🩸 Apple’s MACD is showing bearish momentum, but the stock remains above its 200 EMA, suggesting a possible rebound. Traders should watch for volume confirmation at these levels to determine the next direction. Year-to-date performance remains slightly negative (-2.24%), but the stock has room to recover if resistance is broken.
👑 "Success lies in identifying the turning points—prepare for both opportunities and risks." — LucanInvestor

AAPL Fib Wedge Gann Square FixedNASDAQ:AAPL
Made this Fib Wedge that shows promising touch points when getting to those highs. What stood out to me more was the areas of consolidation consistently showed inside the Gann Square Fixed.
Something to watch is this new area that Apple can go to marked with a "Star"
Watch for the "Star"
Following the past 3 Fibs inside the Gann Square Fixed, a trend we can see is that you touch the high in the range and bounce off into consolidation. I expect to get this range around the "Star"
Once that high in the range is met we can consolidation. I see this consolidation being brief and breaking out of that range soon due to volatility like the previous zone, making new highs.
Make sure the chart looks like the chart on X post before you clicked on it.
Posted the chart on X.
Comment what you think about this chart.
Comment any tips or suggestions.
NASDAQ:AAPL

APPLE SUPPORT AHEAD|LONG|
✅APPLE will soon retest a key support level of 237.00$
While trading in an uptrend
So I think that the stock will make a rebound
And go up to retest the supply level above at 250.00$
LONG🚀
✅Like and subscribe to never miss a new idea!✅

Apple local bottom .. Higher from hereApple broke out to ATH... It has recently pulled back with the broader market. It tapped the 1.272 fib. I believe this could be the bottom or worst case it heads down closer to its ATH breakout point at the 1.618 fib around 237. I'm leaning more towards Apple and the broader market heads up from here... See what happens.

Top 5 Weekly Trade Ideas #3 - Mag 7 SupportThe mag 7 bounced at 2,225 once again while SPY hit $585 this morning so that was pretty good. It may be headed back to the top of the range from here, but the best move will come if it breaks below 2,225 or reclaims 2,300.
Rangebound for now, but will be very important for bulls to watch if it tries 2,225 again and breaks. Seems fine otherwise, but also has a gap fill shortly above that could act as resistance.

AAPL near top around $243, pullback to $234MODs have suggested that I provide more detail about the picks I make.
Sorry. I'm not as verbose as y'all, and I don't like things to be complicated.
My trading plan is very simple.
I buy or sell at top & bottom of parallel channels.
I confirm when price hits Fibonacci levels.
So...
Here's why I'm picking this symbol to do the thing.
Price at or near top of channels (period 100 52 39 & 26)
Stochastic Momentum Index (SMI) at overbought level
VBSM is spiking positive
Price at or near 2.618 Fibonacci level
Buying puts or NASDAQ:AAPD when price reaches or exceeds $242
NASDAQ:AAPL downside target would be $234 or channel bottom

AAPL Technical Analysis and Options Strategy. Jan. 2, 20251-Hour Chart Technical Analysis:
1. Price Action:
* AAPL is trending within a descending channel, with lower highs and lower lows visible on the 1-hour timeframe.
* Current price is hovering near $250.41, with immediate support at $245.74 and resistance at $256.00.
* The price is showing signs of consolidation, attempting to form a base near the channel’s lower trendline.
2. Indicators:
* MACD: The MACD histogram is slightly negative, indicating bearish momentum is still dominant. However, there is a possible flattening of the histogram, signaling a slowdown in the bearish pressure.
* Stochastic RSI: The RSI is nearing the oversold zone, which may indicate an upcoming reversal or bounce from current levels.
3. Trading Strategy:
* Entry for Long:
* Wait for a bullish breakout from the descending channel.
* Confirm with a green candle closing above $252, accompanied by increasing volume.
* Stop Loss:
* For a long position, place the stop loss just below $245.74.
* Targets:
* Target 1: $256.00 (channel resistance).
* Target 2: $260.10 (next key resistance level).
* Entry for Short:
* If the price breaks below $245.74 with bearish momentum, enter a short position.
* Confirm with MACD showing increasing red bars and RSI trending downward.
* Stop Loss:
* For a short position, place the stop loss just above $252.00.
* Targets:
* Target 1: $240.00 (psychological level).
* Target 2: $236.00 (next support zone).
Daily GEX (Options Gamma Exposure) Analysis:
1. Key Levels:
* High Positive Gamma (Resistance):
* $256.00: Strong resistance zone with 80.76% of gamma exposure concentrated here.
* High Negative Gamma (Support):
* $245.00 and $240.00: Key support levels with significant put support.
2. Options Oscillator Insights:
* IVR (Implied Volatility Rank): 31.2, indicating moderately low implied volatility compared to historical levels.
* GEX: Negative (-5.38%), suggesting that dealers may sell into rallies, which could add downward pressure.
3. Options Trading Strategy:
* Bullish Option Play:
* Buy a Call Debit Spread:
* Buy the $252.50 call and sell the $260.00 call, targeting a breakout above $256.00.
* Expiration: 2-3 weeks out to capture potential upward momentum.
* Breakeven: Near $254, with maximum profit at $260.00.
* Bearish Option Play:
* Buy a Put Debit Spread:
* Buy the $245.00 put and sell the $240.00 put, targeting a breakdown below $245.00.
* Expiration: 1-2 weeks to capitalize on quick downward moves.
* Breakeven: Near $243.00, with maximum profit at $240.00.
Conclusion:
AAPL is currently in a consolidation phase within a descending channel. A breakout above $252 or breakdown below $245.74 will provide directional clarity for both stock trading and options strategies. Monitor volume and key gamma levels for confirmation of the next move.
Disclaimer: This analysis is for educational purposes only and does not constitute financial advice. Always conduct your own research and consult with a financial advisor before making trading decisions.

Apple Inc. (AAPL) Analysis and Price Projections for 2025Analysis and Price Projections for 2025 (3-to-5-Month Outlook)
Below is my analysis with a focus on Elliott Wave patterns, Fibonacci levels, and potential buy-the-dip opportunities.
Apple Inc. (AAPL)
Current Price: $250.42
Key Levels:
Resistance: $260.10 (near the 0.290 Fibonacci level).
Support: $228.05 (50% retracement), $220.49 (61.8% retracement).
Outlook: AAPL appears to be in a corrective wave (possibly Wave A of a larger ABC correction). The stock may test the 50% retracement level at $228.05 or the 61.8% level at $220.49 and are viewed as potential buy-the-dip opportunities.
Projection: A bounce from these levels could lead to a retest of $260.00 by mid-2025 and possibly $275.00 by year end.

Apple Inc. (AAPL): Bullish Sequence with Elliott Wave Analysis🚨 Disclaimer: This analysis is for educational purposes only and is not financial advice. Always conduct your own due diligence before making trading or investment decisions.
Key Highlights:
Elliott Wave Structure:
- Apple showcases a bullish Elliott Wave sequence on the weekly chart.
- Cycle Wave I has completed, followed by a corrective Cycle Wave II (a W-X-Y pattern), and the chart suggests Apple is now in the early stages of Cycle Wave III.
- Primary Wave (I) within Cycle Wave III is nearly complete, with an expected pullback into Primary Wave (II).
Current Price Action:
- Apple is trading at $250.42.
- Near-term consolidation and a corrective phase are expected, potentially bringing prices back to the $220-$200 zone.
Correction Levels:
Wave (II) Target Zone:
Support projected between $220 - $200, aligning with key Fibonacci retracement levels.
Invalidation Level: Below $124.06. If this level is breached, the bullish sequence may no longer be valid.
Future Projections:
- After completing Wave (II), Apple is poised for a strong Wave (III) rally.
- Long-term Target: Price levels beyond $300 - $350, driven by the next impulsive wave.
Action Plan:
For Long-Term Investors:
Consider holding through any upcoming corrections, as the long-term trend remains bullish.
Use the correction phase to accumulate shares in the $220-$200 range for the next rally.
For Swing Traders:
Watch for confirmation of the corrective phase to identify short-term shorting opportunities.
Plan to enter long positions near the projected Wave (II) bottom to ride the next wave higher.
Fundamental Catalysts to Watch:
- Product Growth: Success of new product launches, including iPhones, Macs, and wearables.
- Ecosystem Expansion: Growth in services revenue (App Store, Apple Pay, subscriptions).
- Macroeconomic Impact: Interest rate policies and their effects on tech valuations.
- Global Supply Chain Stability: Potential disruptions impacting product deliveries.
Final Thoughts:
Apple continues to be a dominant player in the tech space with solid fundamentals and a robust growth outlook.
While short-term corrections are expected as part of the Elliott Wave pattern, the long-term bullish trend remains intact. Be patient and strategic during pullbacks to maximize gains during the next rally.
📊 Follow for More Analyses: Stay updated with detailed Elliott Wave and technical analyses. Share your thoughts in the comments—do you see Apple breaking $300 by 2026? 🚀

Bitcoin VS AppleApple's product releases came out today.
But it has nothing to do with this publication, just a coincidence.
As you know, I've been analyzing fractals of other assets for a long time. I find the comparison between Apple and Bitcoin very interesting and similar.
I'm inspired by this analysis as much as the previous ones
And the end of this bitcoin market will be around September 2025.
I don't listen to the noise that's coming from everywhere.
I'm following my own plan.
Best regards EXCAVO

AAPL heads up at $240: Breakout Barrier on way to $257 and TOP?AAPL finally trying to break out to new highs.
Watching the BreakOut Barrier above for clues.
Double Golden Fibs would make for a nice TOP.
$ 239.41 - 241.19 is the BreakOut Barrier.
$ 248.86 - 248.72 a quick breakout target.
$ 257.41 - 257.86 Double Golden is the KEY.
=========================================
.

What is going on with appleOk so apple is on a run I am up over $2300 and I want you to tell me what you think I should do at this point.
