BP Breakout in Motion! – Triangle Sends a Signal”
📈 Trade Snapshot:
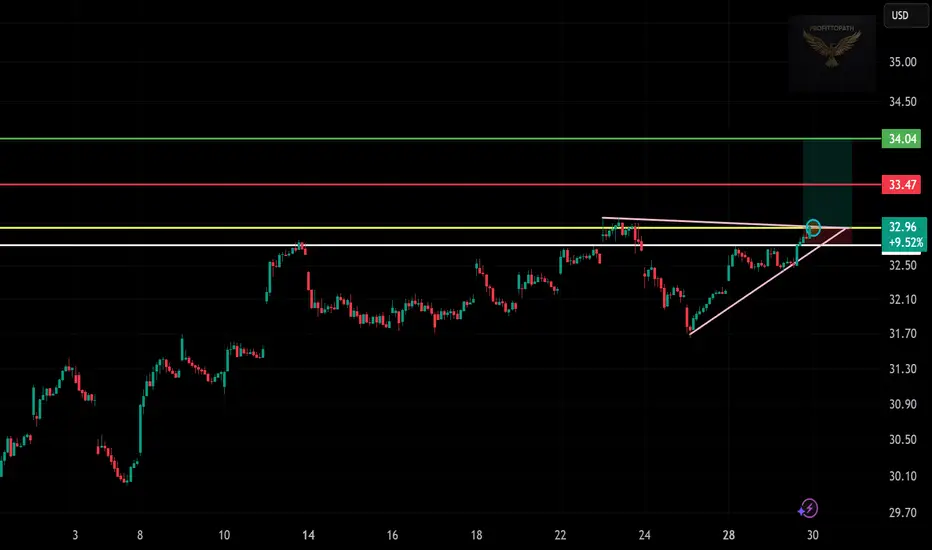
BP breaks above resistance with rising volume, forming higher lows on a clean ascending triangle. Breakout above $32.96 opens the door toward $34.04.
🎯 Setup Details:
→ Entry: $32.96
→ SL: ~$32.30
→ Target: $34.04
→ Resistance to clear: $33.47
📌 Patte
Key facts today
Next report date
—
Report period
—
EPS estimate
—
Revenue estimate
—
176.9075
0.0305 EUR
369.80 M EUR
178.93 B EUR
14.80 B
About BP ORD USD0.25
Sector
Industry
CEO
Murray Auchincloss
Website
Headquarters
London
Founded
1908
ISIN
GB0007980591
FIGI
BBG000K1QP37
BP Plc operates as an integrated oil and gas company providing carbon products and services. It operates through the following segments: Gas and Low Carbon Energy, Oil Production and Operations, and Customers and Products. The Gas and Low Carbon Energy segment includes upstream businesses focused on natural gas production, gas marketing and trading activities, as well as solar, wind, and hydrogen ventures. The Oil Production and Operations segment comprises regions with upstream activities that predominantly produce crude oil. The Customers and Products segment includes customer-focused businesses, including convenience and retail fuels, EV charging, Castrol, aviation, B2B, and midstream, along with refining, oil trading, and bioenergy businesses. The company was founded by William Knox D'Arcy in 1908 and is headquartered in London, the United Kingdom.
Related stocks
3 Explosive Setups I'm looking at this week $TSLA, $BAC, and $BPThis week should be massive for these 3 stocks.
I'm waiting for a signal on the weekly and all of these stocks should run to price targets.

$BP’S COMEBACK? ELLIOTT’S STAKE & UNDERVALUATION BUZZBP’S COMEBACK? ELLIOTT’S STAKE & UNDERVALUATION BUZZ
1/7
BP ( NYSE:BP ) just got a jolt of activist energy ⚡️ as Elliott Management took a significant stake. Shares surged 7% to 464.75 pence—the highest since August. Are we witnessing the start of a big turnaround? Let’s break down the numbers.

BP: Positioned for a Strong 2025**BP: Positioned for a Strong 2025** ⛽📈
With the energy sector set to benefit from a pro-oil environment, BP stands as a solid opportunity for 2025. A potential rise in commodity prices, driven by favorable policies, could support higher margins and shareholder returns. While tariffs remain a ris

BP LongBP is finally breaking this downtrend.
You can have a very tight stop with a great RR, granted, you'll need a lot of capital to put up for a sizeable return.

BP to $33.50MODs have suggested that I provide more detail about the picks I make.
Sorry. I'm not as verbose as y'all, and I don't like things to be complicated.
My trading plan is very simple.
I buy or sell at top & bottom of parallel channels.
I confirm when price hits Fibonacci levels.
Bonus if a TTM Sq

BP Slides on Profit Warning due to Impairments & Refinin IssuesBP plc (BP) investors are jittery after the company's stock price dropped 3% on news of potential asset impairments and weaker-than-expected refining margins. This announcement follows similar cautions from Exxon Mobil, pointing to industry-wide issues within the energy sector.
BP expects to incur

Short BPClear Setup on BP, targetting 360 $ first.
Confirmation : Breaker Block, liquidity below, High Resistance to Low Resistance,

BP about to Bounce?BP is coming close to a long term trend line. If it touches this line the probability of it bouncing upwards shortly after touching or crossing is good based on historical interactions. Also, the RSI and MACD appear to be in the first stages of reversing direction. Probabilities would be higher o

BP Options Ahead of EarningsAnalyzing the options chain and the chart patterns of BP p.l.c. prior to the earnings report this week,
I would consider purchasing the 38.50usd strike price Calls with
an expiration date of 2024-5-17,
for a premium of approximately $1.05.
If these options prove to be profitable prior to the earning

See all ideas
Summarizing what the indicators are suggesting.
Neutral
SellBuy
Strong sellStrong buy
Strong sellSellNeutralBuyStrong buy
Neutral
SellBuy
Strong sellStrong buy
Strong sellSellNeutralBuyStrong buy
Neutral
SellBuy
Strong sellStrong buy
Strong sellSellNeutralBuyStrong buy
An aggregate view of professional's ratings.
Neutral
SellBuy
Strong sellStrong buy
Strong sellSellNeutralBuyStrong buy
Neutral
SellBuy
Strong sellStrong buy
Strong sellSellNeutralBuyStrong buy
Neutral
SellBuy
Strong sellStrong buy
Strong sellSellNeutralBuyStrong buy
Displays a symbol's price movements over previous years to identify recurring trends.
B
BP4923682
BP Capital Markets America, Inc. 3.067% 30-MAR-2050Yield to maturity
7.86%
Maturity date
Mar 30, 2050
B
BP5026513
BP Capital Markets America, Inc. 2.772% 10-NOV-2050Yield to maturity
7.04%
Maturity date
Nov 10, 2050
B
BP5258951
BP Capital Markets America, Inc. 3.001% 17-MAR-2052Yield to maturity
6.97%
Maturity date
Mar 17, 2052
90MW
BP CAPITAL MARKETS PLC 0.933% GTD SNR NTS 04/12/2040Yield to maturity
5.65%
Maturity date
Dec 4, 2040
See all BPE5 bonds
Curated watchlists where BPE5 is featured.

Big Oil: Integrated energy companies
10 No. of Symbols

Oil stocks: Liquid black gold
6 No. of Symbols

Political stocks: The corridors of power
15 No. of Symbols

UK stocks: Best of British
28 No. of Symbols
See all sparks
Frequently Asked Questions
The current price of BPE5 is 4.8715 EUR — it has decreased by −0.81% in the past 24 hours. Watch BP PLC stock price performance more closely on the chart.
Depending on the exchange, the stock ticker may vary. For instance, on SWB exchange BP PLC stocks are traded under the ticker BPE5.
BPE5 stock has risen by 4.99% compared to the previous week, the month change is a 10.57% rise, over the last year BP PLC has showed a −2.67% decrease.
We've gathered analysts' opinions on BP PLC future price: according to them, BPE5 price has a max estimate of 6.86 EUR and a min estimate of 4.00 EUR. Watch BPE5 chart and read a more detailed BP PLC stock forecast: see what analysts think of BP PLC and suggest that you do with its stocks.
BPE5 reached its all-time high on Sep 19, 2000 with the price of 11.1000 EUR, and its all-time low was 2.1120 EUR and was reached on Oct 28, 2020. View more price dynamics on BPE5 chart.
See other stocks reaching their highest and lowest prices.
See other stocks reaching their highest and lowest prices.
BPE5 stock is 1.17% volatile and has beta coefficient of 1.46. Track BP PLC stock price on the chart and check out the list of the most volatile stocks — is BP PLC there?
Today BP PLC has the market capitalization of 75.47 B, it has increased by 7.30% over the last week.
Yes, you can track BP PLC financials in yearly and quarterly reports right on TradingView.
BP PLC is going to release the next earnings report on Nov 4, 2025. Keep track of upcoming events with our Earnings Calendar.
BPE5 earnings for the last quarter are 0.13 EUR per share, whereas the estimation was 0.13 EUR resulting in a 0.00% surprise. The estimated earnings for the next quarter are 0.11 EUR per share. See more details about BP PLC earnings.
BP PLC revenue for the last quarter amounts to 39.58 B EUR, despite the estimated figure of 39.58 B EUR. In the next quarter, revenue is expected to reach 36.32 B EUR.
BPE5 net income for the last quarter is 1.42 B EUR, while the quarter before that showed 651.25 M EUR of net income which accounts for 118.23% change. Track more BP PLC financial stats to get the full picture.
Yes, BPE5 dividends are paid quarterly. The last dividend per share was 0.07 EUR. As of today, Dividend Yield (TTM)% is 5.77%. Tracking BP PLC dividends might help you take more informed decisions.
BP PLC dividend yield was 6.16% in 2024, and payout ratio reached 1.30 K%. The year before the numbers were 4.82% and 31.82% correspondingly. See high-dividend stocks and find more opportunities for your portfolio.
As of Aug 9, 2025, the company has 100.5 K employees. See our rating of the largest employees — is BP PLC on this list?
EBITDA measures a company's operating performance, its growth signifies an improvement in the efficiency of a company. BP PLC EBITDA is 28.64 B EUR, and current EBITDA margin is 16.96%. See more stats in BP PLC financial statements.
Like other stocks, BPE5 shares are traded on stock exchanges, e.g. Nasdaq, Nyse, Euronext, and the easiest way to buy them is through an online stock broker. To do this, you need to open an account and follow a broker's procedures, then start trading. You can trade BP PLC stock right from TradingView charts — choose your broker and connect to your account.
Investing in stocks requires a comprehensive research: you should carefully study all the available data, e.g. company's financials, related news, and its technical analysis. So BP PLC technincal analysis shows the buy rating today, and its 1 week rating is buy. Since market conditions are prone to changes, it's worth looking a bit further into the future — according to the 1 month rating BP PLC stock shows the sell signal. See more of BP PLC technicals for a more comprehensive analysis.
If you're still not sure, try looking for inspiration in our curated watchlists.
If you're still not sure, try looking for inspiration in our curated watchlists.