Electronic Arts (EA) AnalysisAfter the investment made on Activision last week, today I bring you an analysis on EA (Electronic Arts).
The mother of Fifa and Madden (for those who were not interested in video games, let's talk about the company's core business), ended a long accumulation phase that lasted from December 2020 on Friday, when the price broke the support structure in the $ 135.30 zone
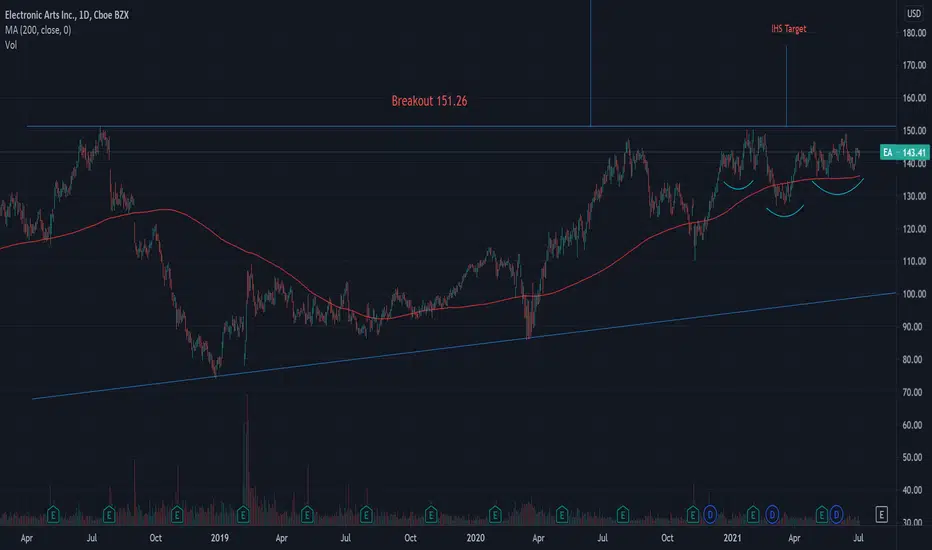
Possible bear trap to create liquidity again and then start a new uptrend. In this case, the resistance to break is $ 149.
If, on the other hand, the price continues to fall, the most interesting entry levels are:
- $ 127
- 112.50 (definitely the most important and attractive level)
Only due to a major reversal of the Nasdaq, EA could it go below this price.
Moreover, we find ourselves in the best time of the year precisely due to the fact that the two previously mentioned video games are out (or just released).
EA, an interesting company in the videogame sector, especially after the subscription service, EA Play, became part of Microsoft's Game Pass , another subscription service to "Netflix" which, with a monthly fee, allows customers to use content .
This too should help the turnover of Electronic Arts grow, which is composed of two other pillars: the sale of video games and in-game microtransactions.
Happy trading.
DISCLAIMER: I am not a financial advisor nor a CPA. These posts, videos, and any other contents are for educational and entertainment purposes only. Investing of any kind involves risk. While it is possible to minimize risk, your investments are solely your responsibility. It is imperative that you conduct your own research. I am merely sharing my opinion with no guarantee of gains or losses on investments.
ERT trade ideas


Bearish Bat Visible On The Monthly This one's kinda simple and not much thought goes into the entry just shorting at the PCZ because i want something to short.

Release BF42 already 127 first, then we will see if it dumps lower but 110 looks like a possibility IMO

$EA long idea$EA consolidating on big triangle, giving us chance for entry here on this higher low. It found support on the .618 retracement + the lower trendline. I like entry here, with tight stop aiming for top of triangle first and will monitor closely for a breakout

Electronic Art: Bias upBroken out from the triangle and into ranging mode. Expect the price to bounce from the support and back up. Short term trade, apply SL and TP to your trade and trade safe.

American stocks EAEA stock
In Time Daily, it forms an ascending triangle that reflects its upward nature in the long run
In time H4, if it retrieves its important floor, and in time h1, after ascending the floor, an ascending nature is visible, it easily breaks the ceiling of the ascending triangle and moves upwards.
In Time H1, it also has an ascending nature. Upward ceilings and upward floors, which become important by retrieving the floor, made a low-risk purchase. Thanks.
Sl = 134.40


Down she goes...EA has had a difficult time breaking past the $150 mark for 3 years. In the past year it's created a triple top as well as a small head and shoulders pattern in the past few months. This week it's broken out of its flag downward.
It can continue traveling within a much larger bull flag pattern and bounce off a major support of $100 in the mid term.
Too slow of a trade of course but if your long EA you'll be holding the bag.
Just an opinion based on the technicals. Do your own DD before making a decision


price can not break historical resistance zoneprice reaches historical resistance zone (140-150 $) and in the last step, buyers demonstrate weakness.
Also we see divergence between price and MACD.
there is high probability for price reduction unless price breaks resistance zone.
use short term trend line for trigger to open short selling position.

Electronic Arts: LONG! Waiting for it to Pop!Great setup for Electronic Arts! This looks like a great stock to me. It's a profitable company, has great franchise and has excellent analyst ratings! I am Longing this stock!

EA looks ready to runLooking for EA to retest ATH. Approaching apex of ascending triangle. Might retest trendline one more time before breaking out.

EA: upward potential from support?A price action above $140.00 supports a bullish trend.
Upside price momentum supports the bullish trend.
The RSI leaves enough room for further upside price potential.
A concern remains the ranging prices.


EA: Upward breakout of the long-term resistance level.Long-term resistance level could be broken upwards with the target level in the area of 190.

EA waiting for a breakout2 year-long ascending triangle
Inverse head & shoulder formed as well
200 DMA holding well


EA Broke Triangle. Best Time to entryNASDAQ:EA
1- Play long best time to entry
2- Follow me and and encourage me to upload more premium ideas.
