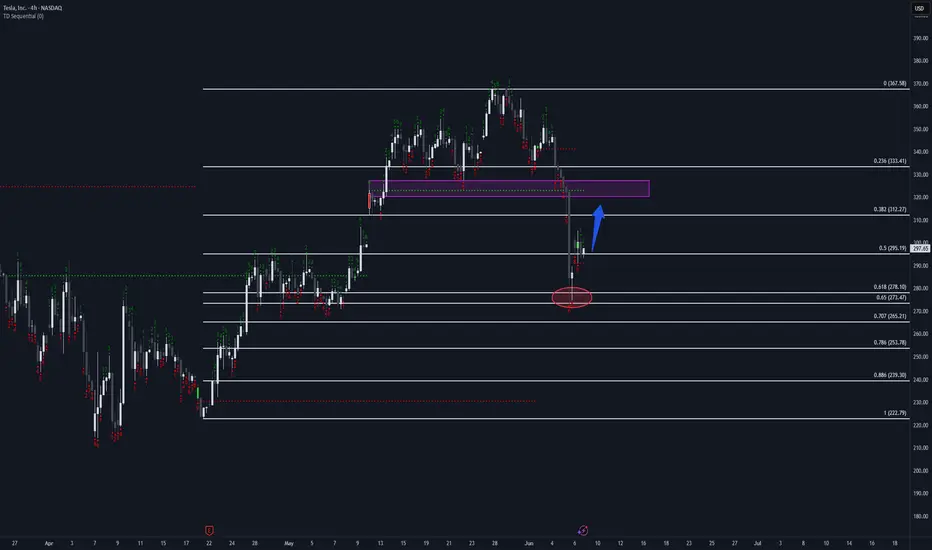
Tesla's Bullish Momentum Points Towards $312 Target
Current Price: $295.14
Targets:
- T1 = $304.50
- T2 = $312.90
Stop Levels:
- S1 = $289.00
- S2 = $282.50
**Wisdom of Professional Traders:**
This analysis synthesizes insights from thousands of professional traders and market experts, leveraging collective intelligence to identify high-probability trade setups. The wisdom of crowds principle suggests that aggregated market perspectives from experienced professionals often outperform individual forecasts, reducing cognitive biases and highlighting consensus opportunities in Tesla.
**Key Insights:**
Tesla continues to demonstrate strong fundamentals backed by innovation in electric vehicles (EV) and sustainable energy solutions. Recent advancements in battery technology, coupled with expansion plans in international markets, are expected to drive significant growth over the next quarter. Technically, the stock shows consistent support levels formed during consolidation phases, suggesting a low-risk entry point for a bullish position. Market momentum indicators signal improving buyer strength, reinforcing the outlook for a continued rally.
**Recent Performance:**
Tesla's stock has shown resilience in the face of broader market volatility. Over the past two weeks, Tesla has moved within a tight range, suggesting accumulation by institutional investors. The recent stabilization around $290-$295 indicates that previous resistance levels have now turned into support, paving the way for further price movement towards higher targets.
**Expert Analysis:**
Analysts at major investment firms have reiterated confidence in Tesla's capacity to maintain its leadership in the EV market. Factors such as improved gross margins, strong quarterly delivery numbers, and strategic partnerships contribute to an optimistic outlook. From a technical standpoint, the stock's moving averages show bullish alignment, indicating sustained upward momentum. Volume analysis portrays strong buying activity, further validating bullish momentum.
**News Impact:**
Positive sentiment has surged following Tesla's announcement of doubling production capacity at its key Gigafactories, including its Nevada facility. Additionally, international regulatory approvals for Tesla's next-generation vehicles have fostered enthusiasm among investors. Broader sector movements, supported by potential shifts in Federal Reserve policy, also boost Tesla's trading outlook.
**Trading Recommendation:**
Tesla offers an attractive long setup for traders looking to capitalize on both fundamental and technical strength. A bullish position at current levels aligns with professional trading insights, with reasonable targets set at $304.50 and $312.90. Recommended stop levels are placed at $289 (S1) and $282.50 (S2), ensuring risk management while allowing room for volatility. With favorable macroeconomic factors improving the environment for growth stocks, Tesla remains a strong candidate for upside potential in the short-term.
TL0 trade ideas

Bulls FailedThe bulls seem to have not the power to bring the stock back up and to close the window of June 5th. The support zone seems to halt.
It is a very strong one lasting since March.

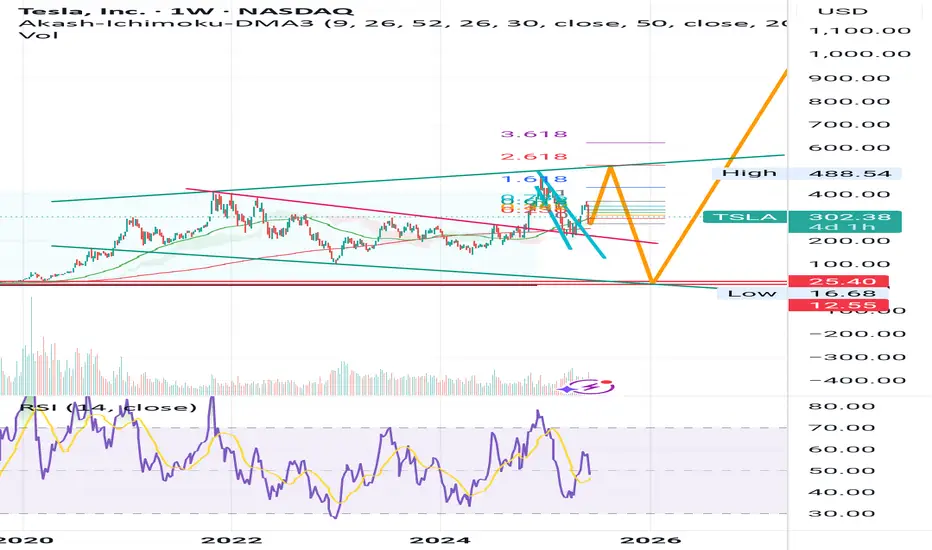
Tesla - There's more after the +60% rally!Tesla - NASDAQ:TSLA - will blow even further:
(click chart above to see the in depth analysis👆🏻)
It is almost incredible to see such a large cap stock rally more than +60% in less than two months. But Tesla is clearly the exception and therefore we should expect the unexpected. What's quite likely is at least another rally of about 25% from here and a retest of the previous all time high.
Levels to watch: $250, $400
Keep your long term vision!
Philip (BasicTrading)

TSLA road to $526... to $10... to da mooo00nHaters gonna hate, but these patterns need to complete, nevermind most of the holders bought in at 10 usd, and that's where the support is.
Not financial advice, not funancial either badum tss
Tesla - Short Term Chart, Bullish BreakoutTesla is surging after a significant pullback. Could this be a turning point? I'm optimistic about Tesla's long-term potential and have been holding for the long haul, anticipating new highs in the future.

The pullback may be over soonI believe we’re approaching a bottom in this correction. I’m expecting a double bottom or a dip below it followed by a rebound.

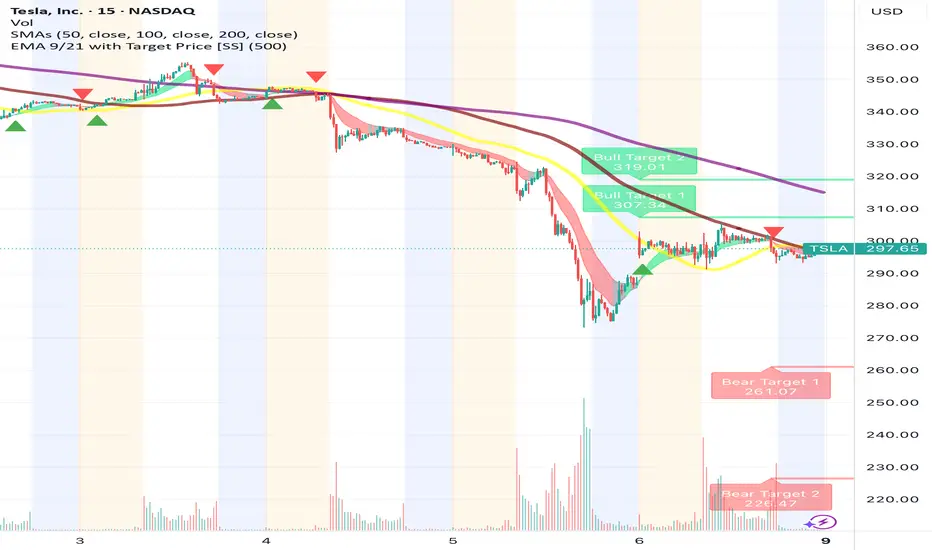
Todays Entry @ $288.45 @ 09:35am | Exit @ $293.03Pre Trade Prep:
EMOTIONAL STATE = 8
TIREDNESS = 7
Execute your edge with robot like consistency, let me the math win for you over the long term.
A surgeon doesn't not operate because his last patient died.
The battle is won before the opening bell rings.
Visualise winning and losing scenarios.
--------
1) Am i physically and mentally ready to trade?
2) Do I have clear plans for todays trades.
3) Am i prepared to walk away if there is no set up?
-------
Today, I will only trade what the system confirms.
Today, I will accept losses with composure.
Today, I will protect my emotional capital.

Support ZoneWe have reached anmimportant support zone reaching from 27th April till May 8th. I think that we shall stop here and gom for an upward retracement.

Safe Entry ZoneCurrent Movement is Down.
The Green 4h Zone @ 277-271 price level is strongest support level price targeting.
Note: 1- Potentional of Strong Buying Zone:
We have two scenarios must happen at The Mentioned Zone:
Scenarios One: strong buying volume with reversal Candle.
Scenarios Two: Fake Break-Out of The Buying Zone.
Both indicate buyers stepping in strongly. NEVER Join in unless one showed up.
2- How to Buy Stock:
On 15M TF when Marubozu Candle show up which indicate strong buyers stepping-in.
Buy on 0.5 Fibo Level of the Marubozu Candle, because price will always and always re-test the imbalance.

Important support and resistance sections: 267.07-311.48
Hello, traders.
If you "Follow", you can always get new information quickly.
Have a nice day today.
-------------------------------------
(TSLA 1D chart)
If you see support within the important support and resistance sections, it is a time to buy.
However, if a strong decline occurs, strong buying is expected around 172.6-234.59.
It is expected to be an important buying period for long-term investment.
-
Thank you for reading to the end.
I hope you have a successful transaction.
--------------------------------------------------

TSLA – Are You Buying Cheap or Buying Expensive?Tesla (TSLA) continues to trade within a long-standing macro range, well-defined by two behavioral zones:
🟩 Value Zone – Accumulation ($132 to $270.50):
This is where smart money tends to accumulate over time. Historically, moves from this zone lead to long-term rallies. Price spent multiple weeks here during major drawdowns — offering long-term entries at discounted value.
🟥 Premium Zone – Profit Taking ($270.50 to $409):
Above the midpoint ($270.50), price enters what can be considered the “expensive” territory. Historically, this area has acted as a supply zone, with frequent distribution and sharp reversals.
TSLA is currently sitting just above the midpoint, testing that equilibrium. Whether it consolidates for another leg higher or fails here could define the next swing move.
So ask yourself:
Are you buying value, or chasing premium?

TESLA SHORT?Are we win for a surprise with tension between Trump and Musk intensifies, with recent comments from President Trump regarding Tesla, we could be in for a bearish probability towards 100 key price level.

Nothing to Be Afraif Of!- Tesla has historically traded at high valuation multiples—and still does. But since its investor base is driven by excitement for the future and a love for innovation, it's unclear how much those valuation metrics really matter.
- After the first higher low structure following a corrective price wave, Tesla surged as much as 227.60%, before facing selling pressure. We're now tracking the second impulsive wave's retracement, particularly the 61.8% and 78.6% Fibonacci levels.
- Trying to catch the bottom at these levels is pointless. It's better to wait for 2–3 green Heikin Ashi candles and confirmation that these levels are holding.
- Current positions can be held. If you want to sell, go ahead—but remember this: No one has stayed optimistic about Tesla for more than two months. So, there's no need to panic.

TSLA-SELL strategy 3D Reg. channelThe share has retraced a bit and restarted its decline. Considering the technical picture of negative impacts and the ongoing statements between the two parties, the case is stronger for a much lower share price. I feel we may see $ 230 or lower breaking below channel support.
Strategy SELL @ $ 290-310 and take profit near $ 195 for now.

Elon vs. Trump Drama, But the Chart Speaks LouderTesla closed at 300.63 with a strong 5.42% jump, but the rebound looks more technical than solid. RSI is at 43.90, still in bearish territory, and the stock hasn’t recovered from the recent drop from 360. The 305–310 zone is key — if it fails to break above that with volume, it might drop back to 280 or even 260.
On top of that, the growing tension between Trump and Elon Musk could weigh on market sentiment, especially with the upcoming election and possible regulatory concerns.
Bottom line: the move up doesn’t look convincing yet. Watch price action and volume closely in the next few days.
#TSLA #Tesla #TechnicalAnalysis #StockMarket #WallStreet
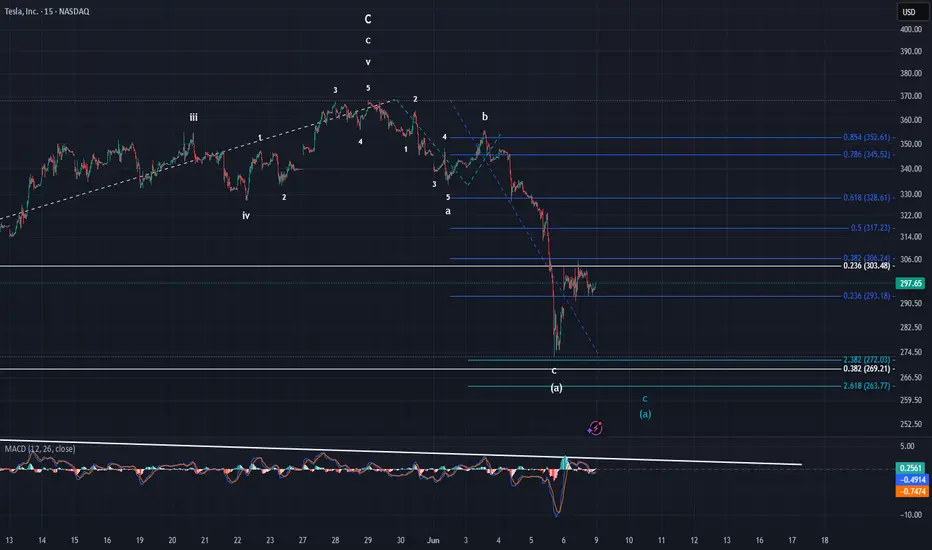
Tesla UpdateTesla has had quite a rough go at it lately. For those of you on trading view that follow me, you may not have had the daily updates as those on my website, but you should've known too by my posts that a decent drop was coming. Just so I am as clear as I can be, this is just the beginning of this consolidation lower. We might not even be done with this current drop for the minuette a wave either. As annotated by the turquoise label and the turquoise fibs, another low is very possible, and I would go so far as to say very probable. The reason why I think it is probable, is the structure that was created on the move lower. It appears like the move higher that started on 05 June is a miniscule wave 4 with 5 yet to come.
Now, another move lower isn't required by any means. We could easily continue higher from here for minuette wave b. That is why I have drawn some blue retracement fibs. If we have in fact bottomed in (a), then we would be targeting the $328-$350 area for (b).
In short, we either make another low from here to the $263 area finishing (a), or we continue higher for wave (b). MACD/structure seems to be indicating the turquoise count will come to pass. Either way we should head higher again soon. If we can make another low towards the 2.618 then I will likely take a small long position to ride out (b).
TSLA cup and handle INVALIDATEDThe TSLA cup and handle breakout case has been invalidated as of Thursday June 5th of this past week. The start of the week showed lack of conviction in the follow through to and over the 360 price level, where sellers stepped up. This indicated a slowdown in bullish momentum and a weakening trend early in the week. The ultimate catalyst that caused the breakdown for TSLA was, of course, the public breakup of Musk and DJT over social media platforms. This caused a "waterfall effect" of intense selling pressure through low volume zones from ~330 to the high volume node and put wall at the 280 level. Price ended up overshooting 280 but ended up reclaiming that level by the end of the session and bounced higher the following day. At this point, the weekly and daily charts are showing a short term wedge formation that may take some weeks to play out. There has not been signs of big institutional buying at the these levels as of now, and as such I suspect that there may be a bit more downside these coming weeks. My current idea is a short/put position under 293.5 to about 273, with a maximum target of 250. If price ends up at or near 250 levels, I would look to start a long position for a play back up to the 300 level.


Key levels for TeslaNASDAQ:TSLA Tesla has reached a support zone "274" and bounced back. Given the close above the first support"294.80", it is expected to rise toward the key resistance area "331"

Tesla to re-test the 320 levelTesla bounced off the 0.618 fib level and wicked above (bullish).
We have a double red 9 on the 4 hour.
Looking for a recovery bounce to 315-320 level.
TSLA: Uptrend channel bounce, trading between 50 and 200-day SMAHey guys/gals!
So we all know that Tesla took a massive drop last week. It fell about 14%, and was down even 3% after hours at one point. I think we can all agree this crash wasn't technicals driven - it was clearly headline impacted. This was a clear black swan even t, and even in my case, nothing like this has ever happened to me as a trader. It was unforeseeable, forced me to hedge overnight and I'm still having nightmares (lol). Definitely one to remember as I don't think something like this would happen with any other stock. Tesla is truly unique in this sense.
But looking at the bigger picture, the bounce that we experienced on Friday must've been technicals driven, and psychologically influenced, as I am almost certain that the crash was a massive overreaction. People woke up the next day and thought this was severely discounted over a couple social media tweets (I won't go into the politics of things).
As you see on the chart, Tesla may in a new upward channel. At first I figured this may be a bear flag, however due to the upcoming catalyst like the Robotaxi launch - this would likely only be a bear flag if prices crashes below the lower support trend line.
As long as price is within the channel, I'd say things are holding up. We'd likely see a jump towards the upper side of the channel - however it's important to note that $300 and £360 are major resistance points. Robotaxi launch and any future tweets will definitely move price, and I think those will be a factor in determining whether price goes up or crashes below the trend line.
Another thing to point out is that price is currently trading between the 50-day and 200-day moving averages. The 50-day SMA is acting as vital support, whereas the 200-day SMA is the resistance. If there is a break above the 200-day SMA, price will likely go higher. The opposite may happen if price crashes below the 50-day SMA.
Either way, headlines and technicals mentioned above will continue to influence price.
Note: not financial advice.

When Intuition Beats the Algorithm█ When Gut Feeling Beats the Bot: How Experience Can Improve Algorithmic Trading
In today’s world of fast, data-driven trading, we often hear that algorithms and rules-based systems are the future. But what happens when you mix that with a trader’s intuition, the kind that only comes from years of watching charts and reading price action?
A recent study has some surprising results: A seasoned discretionary trader (someone who trades based on what they see and feel, not just rules) was given a basic algorithmic strategy. The twist? He could override the signals and use his instincts. The result? He turned a losing system into a winning one, big time.
█ What Was the Experiment?
Researchers Zarattini and Stamatoudis (2024) wanted to test whether a skilled trader’s experience could boost a mechanical system. They took 9,794 stock “gap up” events from 2016 to 2023, where a stock opens much higher than the day before, and let the trader pick which ones looked promising.
⚪ To make it fair:
All charts were anonymized — no names, no news, no distractions.
The trader had only the price action to guide his choices.
He could also manage open trades — adjusting stop-losses, profit targets, and position sizing based on what the price was doing.
⚪ The Trading Setup
█ What Did They Find?
The trader only selected about 18% of all the gap-ups. But those trades performed far better than the full list. Here's what stood out:
Without stop-losses, the basic strategy lost money consistently (down -0.25R after just 8 days).
With the trader involved, profits rose fast, hitting +0.80R just 4 days after entry.
Risk was tightly managed: only 0.25% of capital was risked per trade.
⚪ So what made the difference? The trader could spot things the system missed:
Strong momentum early in a move
Clean breakouts from long sideways ranges
Patterns that had real follow-through, not just random gaps
He avoided weak setups and managed trades like a pro, cutting losers, letting winners run, and trailing positions with smart stop placements.
⚪ Example
An experienced trader can quickly identify a breakaway gap, when a stock gaps up above a clear resistance level. Unlike random gaps, this setup often signals the start of a strong move. While a system might treat all gaps the same, a skilled trader knows this one has real potential.
█ What Does This Mean for You?
This research shows that trading experience still matters — a lot.
If you’re a systematic trader, adding a discretionary filter (whether it’s your own review or someone else’s) could drastically improve your results. A clean chart read can help you avoid false signals and focus only on the best setups.
If you’re a discretionary trader, this study is proof that your skills can add measurable value. With the right tools and discipline, you don’t need to throw away your instincts, you can combine them with structure and still win.
█ Key Takeaways
⚪ Gut feeling isn’t just noise, trained instincts can spot what rules miss.
⚪ Trade selection matters more than just following every signal.
⚪ Managing risk and exits well is just as important as picking good entries.
⚪ Hybrid trading, rules plus judgment — might be the most powerful combo.
-----------------
Disclaimer
The content provided in my scripts, indicators, ideas, algorithms, and systems is for educational and informational purposes only. It does not constitute financial advice, investment recommendations, or a solicitation to buy or sell any financial instruments. I will not accept liability for any loss or damage, including without limitation any loss of profit, which may arise directly or indirectly from the use of or reliance on such information.
All investments involve risk, and the past performance of a security, industry, sector, market, financial product, trading strategy, backtest, or individual's trading does not guarantee future results or returns. Investors are fully responsible for any investment decisions they make. Such decisions should be based solely on an evaluation of their financial circumstances, investment objectives, risk tolerance, and liquidity needs.

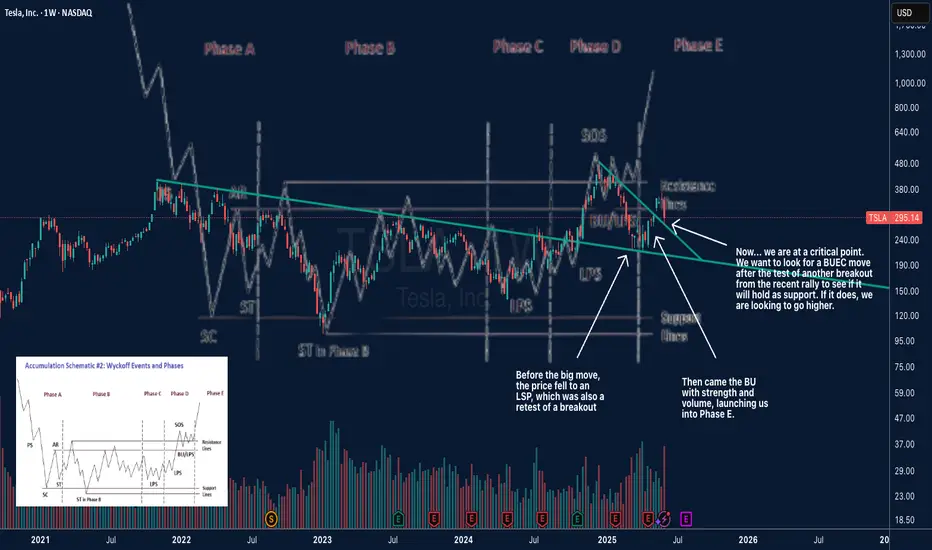
Is Tesla telling a classic story right on its chart?This looks like a textbook example of Richard Wyckoff's "Creek" analogy. For months, the stock faced a "creek" of selling pressure around the $280-$300 resistance line, turning back any attempt to move higher.
Before the big move, the price "backed up" to a Last Point of Support (LPS) to gather steam—that was the dip we saw back in Phase D. Then came the powerful "Jump Across the Creek," a breakout with strength and volume, launching us into what appears to be Phase E.
But the story isn't over. The sharp pullback we're seeing now isn't necessarily failure. It's the critical "Back-Up to the Edge of the Creek." The stock is testing if the old resistance (the far bank of the creek) will now hold as new support.
The question now is: Does the ground hold for the next launch higher, or does the price fall back into the water? This is the moment of truth.