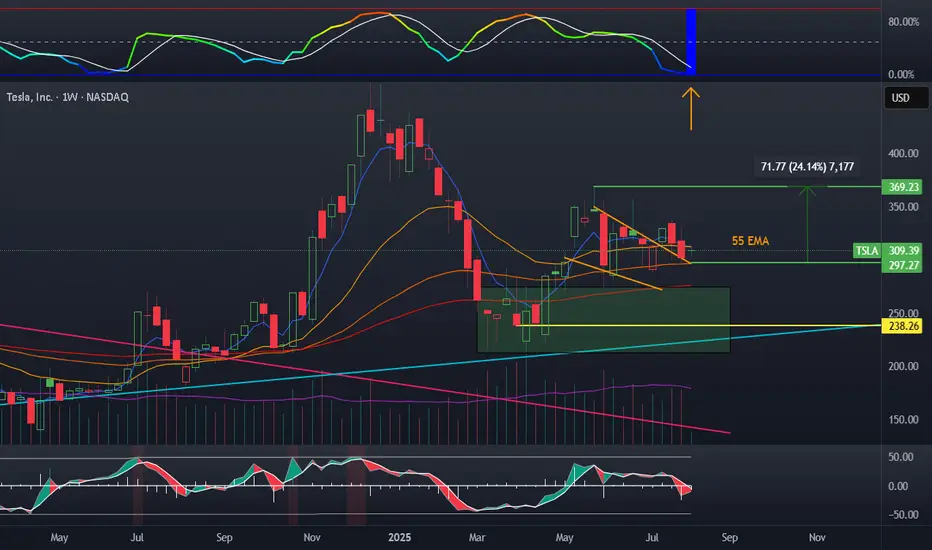
Tesla wedge and volatilityTesla has been riding this wedge downward after a false breakout on terrible earnings. BBWP has flashed blue, which has not happened since 2017, which is a signal for me. Stochastic has reset, and a stall candle is forming. Volume is generally up.
My plan:
TSLL shares, possible cash secured puts
TL0 trade ideas
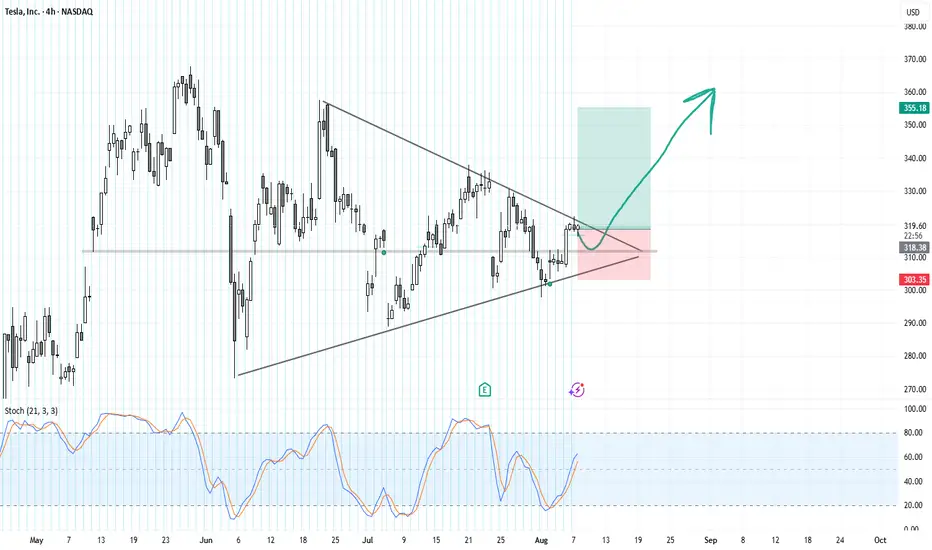
TSLABased on the provided 4-hour chart of TSLA, here is a brief summary and outlook.
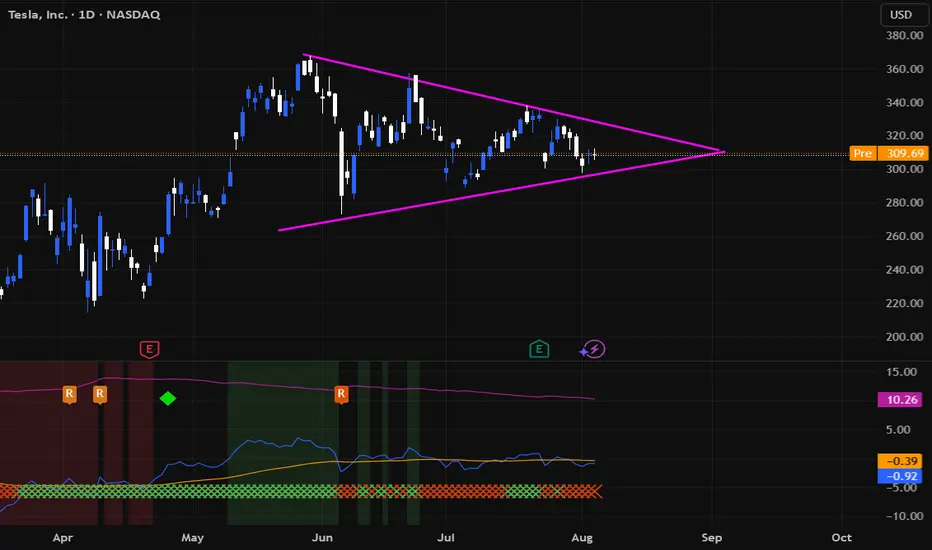
Tesla's stock price has been consolidating within a symmetrical triangle pattern since late May. The price is currently trading near the upper boundary of this triangle, which is a critical resistance level. The stochastic indicator is showing a bullish crossover and is trending upwards, but it is not yet in the overbought territory.
The chart presents two potential scenarios for the immediate future. A bullish breakout (green arrow) would occur if the price successfully breaks above the upper trendline and the resistance around $320. This could lead to a significant move towards the next target, potentially around $355, as indicated by the length of the triangle's base. Conversely, a bearish scenario (red shaded area) would see the price fail to break out and instead fall back towards the lower support trendline, possibly testing the support level around $303.
The key to the next move is a decisive breakout from the current pattern. Traders should monitor for a clear break above or below the trendlines with increased volume to confirm the direction. A successful breakout to the upside would signal a continuation of the previous uptrend, while a breakdown to the downside would suggest a potential bearish reversal. The support and resistance levels marked on the chart are key reference points for managing risk and setting targets.
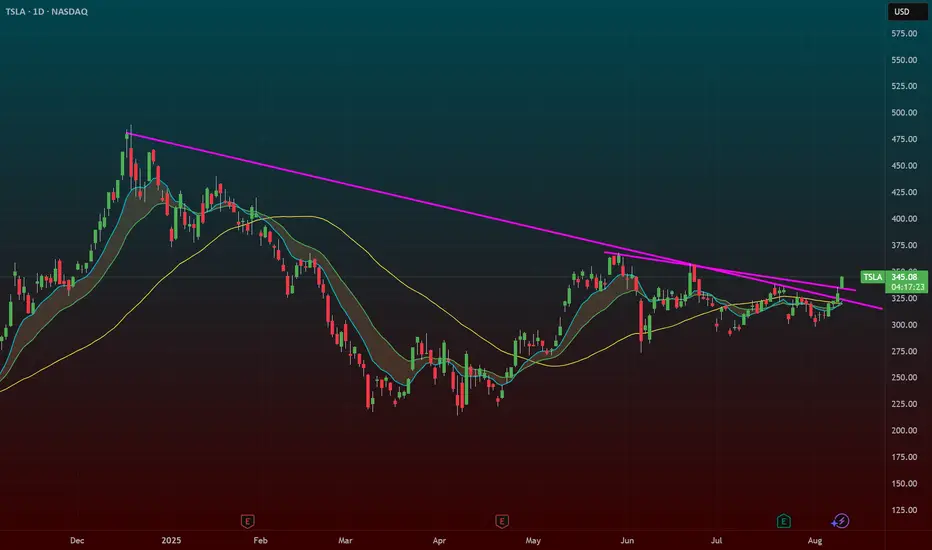
TESLA Lagging BehindA compelling reason to buy Tesla stock now—despite it being beaten down—is the asymmetric risk-reward setup driven by its depressed valuation relative to long-term growth potential. Sentiment is currently low due to concerns about EV demand, competition, and Elon’s distractions, but this pessimism is largely priced in. Meanwhile, Tesla still holds massive optionality: AI-driven autonomy, energy storage, and Dojo supercomputing. If even one of these verticals scales meaningfully, current prices may prove a generational entry.
At the moment, we are hitting some of my key support levels being the anchored vwap from the low , as well as the previous Value Area High range retest within the formation of this broader triangle, suggesting a potential continuation to the upside should we get a strong breakout.
I will be watching for further down side as the current risk is only approx 6-7% for a potential upside of 60%-70% , a massive Risk to reward.
Should this reclaim the downtrend vwap, it can be a strong sign of strength for this stock to move back to ATH's as tesla is massively lagging behind.

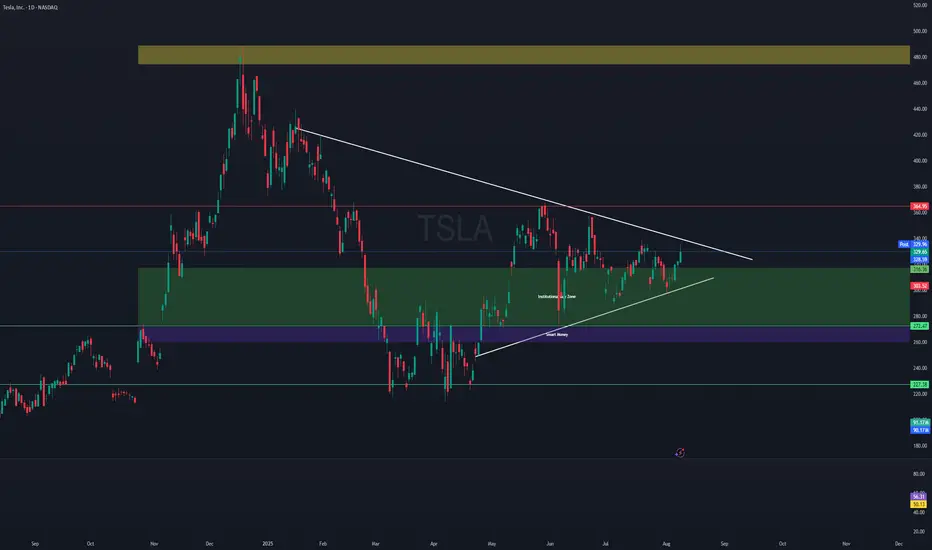
$TSLA – Wedge Breakout with Rotation PotentialNASDAQ:TSLA – Breaking Out of a Big Wedge After Earnings Reversal
Tesla ( NASDAQ:TSLA ) just broke its wedge pattern after a strong post-earnings recovery, and the price action says a lot about where sentiment is shifting.
🔹 Earnings Flush → Strong Absorption
Earnings reaction was ugly — big gap down and heavy selling.
Since then, NASDAQ:TSLA has been shrugging off negative news — sales data, guidance cuts, analyst downgrades — all absorbed without breaking down.
This tells me buyers are quietly accumulating.
🔹 Rotation Narrative
The rest of the Mag 7 has been ripping for months.
NASDAQ:TSLA is the laggard — and now traders are rotating into the one big name that hasn’t moved yet.
If it holds here, the upside could be sharp.
🔹 My Trade Plan:
1️⃣ Starter Long: Took an entry on the wedge trendline break.
2️⃣ Why Not Full Size Yet? This is day 4 of the move — in my playbook, that’s a starter size only.
3️⃣ Add Trigger: If we get an inside day or small dip that holds above the 9 EMA, I’ll add the rest of the position.
4️⃣ Stop: Under the wedge breakout level for now.
Why I Like This Setup:
Wedge break + rotation narrative + strong news absorption.
Market psychology turning — when a stock stops going down on bad news, it’s often about to go up.
Starter now, add on the dip = structured risk.
TSLA is looking ready for breakout NASDAQ:TSLA is making higher lows, looks like getting ready to be a rocket. keep an eye on 340 break and retest.
Cyclical Stocks vs Non-Cyclical Stocks: How Can You Trade Them?Cyclical Stocks vs Non-Cyclical Stocks: How Can You Trade Them?
Not every stock is created equal. One of the biggest distinctions is cyclical vs non-cyclical—those that grow or decline alongside economic conditions and those that are less sensitive. In this article, we explore the key differences between the two, how to analyse both, and how to trade them.
What Are Cyclical Stocks?
Cyclical stocks are those that rise and fall in line with the broader economy. They’re more sensitive to consumer spending and include those in the travel, automotive, construction, and luxury goods sectors.
Simply put, when consumers have more disposable income, they’re likely to buy new cars, travel abroad, or invest in home improvements. Demand boosts corporate earnings and pushes share prices higher. However, when consumers have less money or face economic uncertainty, they reduce and delay spending on these discretionary purchases, dampening company earnings and stock valuations.
Nike and Starbucks are good examples here—both are cyclical companies that see higher demand when consumers are in a stronger financial position and feel comfortable purchasing brand-name clothes or buying coffee on the go.
Cyclical stocks tend to be more volatile than non-cyclical ones. Their sensitivity to cyclical business conditions offers potential opportunities for traders to capitalise on a growth phase, but timing matters—getting caught in a temporary or prolonged downturn can lead to sharp drawdowns.
Cyclical Sectors
- Automotive
- Airlines & Travel
- Luxury Goods & Apparel
- Construction & Materials
- Banking & Financial Services
- Technology & Semiconductors
- Restaurants & Entertainment
- Retail (Discretionary Spending)
Is Tesla a Cyclical Stock?
Yes, Tesla is a cyclical stock. Demand for electric vehicles moves in line with economic conditions, consumer spending, and interest rates.
Is Amazon a Cyclical Stock?
Amazon is partly cyclical. Its retail business depends on consumer spending but its cloud computing division (AWS) sees constant demand and provides diversification.
What Are Non-Cyclical Stocks?
Non-cyclical stocks belong to companies that sell essential goods and services. Contrasting with cyclical stocks and their sensitivity to consumer spending, non-cyclical companies sell things people buy regardless of economic conditions. They’re often referred to as defensive stocks because they tend to hold up when the economy weakens.
Non-cyclical sectors include healthcare, utilities, and consumer staples. Supermarkets, pharmaceutical companies, and electricity providers see relatively steady demand because people still need food, medicine, and power whether the economy is growing or contracting.
For example, consumer non-cyclical stocks, like Procter & Gamble, which owns brands like Oral-B, Charmin, and Gillette, continue to generate revenue year-round because consumers still buy everyday household items. The same goes for Johnson & Johnson, which sells medical products that hospitals and pharmacies need.
Compared to cyclical stocks, non-cyclical stocks are usually less volatile because their earnings are more consistent. While their potential returns are relatively limited vs their more growth-oriented cyclical counterparts, non-cyclical stocks are believed to not dive as sharply during a downturn.
Non-Cyclical Sectors
- Consumer Staples (Everyday Goods)
- Healthcare & Pharmaceuticals
- Utilities (Electricity, Water, Gas)
- Telecommunications
- Grocery & Essential Retail
- Defence & Aerospace
How Traders Analyse Cyclical Stocks
In a market where going long or short volatile cyclical stocks is an option (such as with CFDs), many prefer to trade them over non-cyclical stocks. More broadly, traders analyse a few key indicators to determine whether cyclical stocks are in a growth phase.
Macroeconomic Indicators
When GDP expands, businesses and consumers spend more, and free-flowing spending boosts demand in cyclical sectors. Similarly, interest rates determine spending on more big-ticket purchases, like cars, homes, and luxury goods. Lower interest rates encourage borrowing and vice versa.
Employment rates also play a key role. More layoffs and a higher unemployment rate mean consumers dial back purchases of discretionary goods and services. Employment conditions, along with economic and policy uncertainty, drive consumer confidence. When optimism is high, cyclical stocks often rally.
Earnings Trends & Sector Data
Unlike non-cyclical companies, cyclical firms see earnings fluctuate based on economic cycles. Traders pay attention to quarterly reports and especially forward guidance. If a company expects strong sales growth due to rising demand, this can drive its stock price higher and possibly signal an upswing in the sector.
Industry-specific data, like auto sales figures or airline bookings, is also a useful gauge for assessing the future performance of a company.
Market Sentiment & Seasonal Trends
Cyclical stocks are prone to seasonal patterns—retailers surge in the holiday season, while travel stocks perform well in summer. Market sentiment is another important factor; for instance, if economic uncertainty is growing but investors on the whole believe it to be a temporary blip, then cyclical stocks may still rise.
Analysing Non-Cyclical Stocks
While traders often favour cyclical stocks for their higher potential returns, many still turn to non-cyclical companies as a possible form of short-term defence against downturns, to balance a long-term portfolio, or when unique occasions arise (earnings reports, company-specific news, etc.).
Earnings Stability & Cash Flow
Since non-cyclical companies sell essential goods and services, their earnings tend to be more consistent. Traders look at revenue trends, gross margins, and free cash flow to assess a firm’s ability to generate relatively steady income. Consistent earnings—even during downturns—can be a marker of a strong non-cyclical stock.
Dividend History & Payout Ratios
Many non-cyclical stocks pay dividends. That makes them attractive for those looking for income-generating assets. A company with a long track record of consistent or growing dividend payments is often a sign of financial strength. The payout ratio (dividends paid as a percentage of earnings) is another metric traders examine—too high, and it could indicate unsustainable distributions.
Market Conditions & Defensive Rotation
If economic uncertainty rises, investors will generally shift into defensive sectors like healthcare, utilities, and consumer staples. Many will monitor fund flows—where institutional money managing exchange-traded funds (ETFs), mutual funds, and large portfolios is headed—to understand if risk aversion is growing.
Likewise, outperformance in certain sectors can be a signal. If sector indices like the S&P 500 Consumer Staples Index or the S&P 500 Healthcare Index outperform the overall S&P 500, it may indicate capital moving into non-cyclical stocks.
Trading Cyclical and Non-Cyclical Stocks
Now, let’s take a closer look at how traders engage with these stocks.
Short-Term Trading
Short-term traders generally focus on stocks or sectors expected to move over hours or days. One strategy might be to examine the broader conditions and trade ahead of earnings reports. If summer is approaching and the economy is doing well, Delta Air Lines could rise in the weeks before an earnings release as traders anticipate strong quarterly performance and positive forward guidance.
Another strategy is trading macro themes. If inflation rises, traders might focus on companies with strong pricing power, like consumer staples firms that can pass costs onto consumers. If economic data points to a slowdown, they might focus on healthcare stocks.
Medium-Term Trading
Medium-term traders take a broader view and typically adjust their portfolio weightings based on economic conditions. During expansions, they may overweight cyclicals like construction and travel stocks, while shifting into non-cyclicals as recession risks grow. That could mean just rebalancing a collection of ETFs, over/under-weighting a set of stocks, or a mix of both.
Here, the focus is usually on broader economic trends while also staying alert for possible strengthening or weakening consumer demand.
Long-Term Trading
Long-term traders often hold a mix of cyclical and non-cyclical stocks to maintain a balanced portfolio across economic cycles. While they may still adjust weightings over time, they tend to be more concerned with long-term sector trends and income generation.
With a longer time horizon, these traders may be more willing to allocate more capital to cyclical stocks during a downturn, especially to otherwise strong companies or sectors, to take advantage of potential rebounds months down the line.
The Bottom Line
Understanding the difference between cyclical and non-cyclical stocks is fundamental to trading them. Careful analysis—macroeconomic, sectoral, and company-specific—can help traders identify potential opportunities across all time horizons.
FAQ
What Are Examples of Cyclical Stocks?
Cyclical stocks include Tesla (TSLA), Delta Air Lines (DAL), Nike (NKE), Caterpillar (CAT), Marriott International (MAR), and Ford (F).
Which Industries Are Most Cyclical?
Highly cyclical industries include automotive, airlines, hospitality, construction, luxury goods, and consumer discretionary retail.
Is Coca-Cola a Cyclical Stock?
No, Coca-Cola is considered a non-cyclical stock. Demand for its wide range of products remains stable regardless of economic conditions.
Is Starbucks a Cyclical Stock?
Yes, Starbucks is a cyclical stock. Coffee purchases aren’t essential, so demand fluctuates based on disposable income and consumer confidence.
This article represents the opinion of the Companies operating under the FXOpen brand only. It is not to be construed as an offer, solicitation, or recommendation with respect to products and services provided by the Companies operating under the FXOpen brand, nor is it to be considered financial advice.
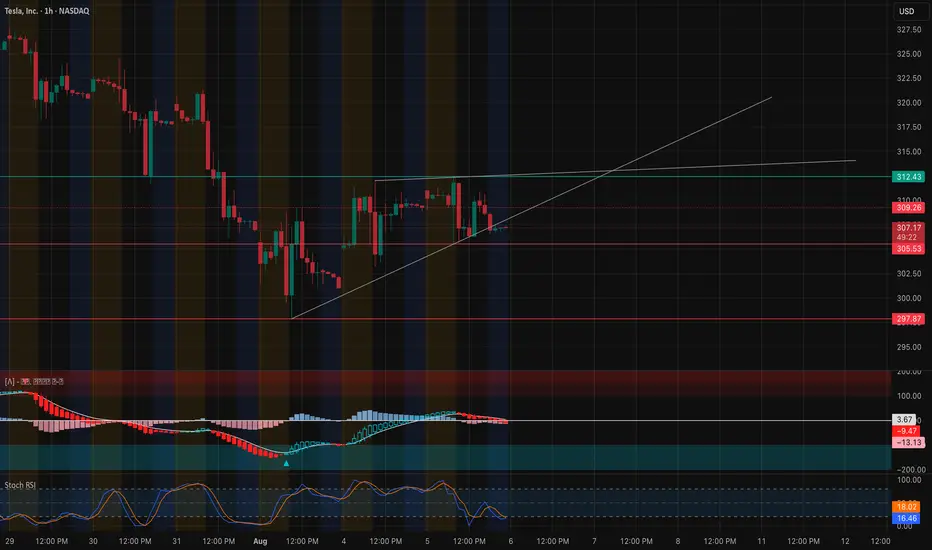
TSLA Breaking Out — But Can It Hold Above $320? Aug. 7📊 Technical Analysis (1H + 15-Min Confluence)
TSLA has surged out of its $308–$312 consolidation range with strong bullish momentum. It's now pressing against the key resistance zone just under $320, with clean price structure and a rising trendline.
* Trend: Higher lows with a breakout above structure = bullish continuation bias
* MACD: Bullish crossover + expanding histogram = momentum building
* Stoch RSI: Overbought at 88+ = short-term cooling possible, but not a sell signal on its own
* Volume: Strong breakout volume confirms interest — now needs follow-through above $320
Key Levels to Watch:
* Support Zones:
* $317.50 (micro support)
* $312.35 (breakout base / trendline confluence)
* $308.72 (former top of range)
* Resistance Zones:
* $319.85 (current high)
* $322.50 (major gamma wall)
* $325 → $330.39 (stacked supply above)
Scalping Setup (15-Min View):
* Entry (CALLs): Break and hold above $320
* Target: $322.50 then $325
* Stop: Below $317.50
* Bias: Momentum continuation as long as price holds trendline + VWAP
🔬 GEX-Based Option Sentiment (1H GEX Map)
The options market is now showing significant gamma resistance overhead, making this a crucial inflection zone:
* CALL Walls:
* $319.85 = 2nd CALL Wall (95.21%) — this is where price is currently pausing
* $322.50 = 3rd CALL Wall (86.55%)
* $325–$330 = GEX10/GEX7 cluster — potential fade zone
* PUT Support:
* $305 = HVL + strong buyer interest
* $300 = -26.58% PUT Wall
* $297.83 = 3rd PUT Wall — major dealer de-hedging zone
* Net GEX Bias:
* Positive GEX above $312.50 → bullish momentum slows as dealers hedge
* Below $305 = faster downside risk (gamma unwind)
* IVR 5.5, IVx Avg 51.4 → IV drop = favorable for buying options, not selling them
🎯 Options Trade Ideas:
* Bullish Swing (Speculative Breakout):
* Entry: Break > $322.50
* Target: $325 / $330
* Stop: < $317.5
* Bearish Fade (Gamma Cap Reversal):
* Entry: Reject below $320 with stalling momentum
* Target: $312.5 / $308
* Stop: Close > $322.5
⚠️ My Thoughts:
TSLA is at a key gamma inflection point. Price structure supports more upside, but dealer positioning above $322.5 may cap momentum unless volume forces a squeeze. Use trendline and VWAP confluence as your confirmation anchors — and watch for failed breakout traps into overhead gamma zones.
This analysis is for educational purposes only and does not constitute financial advice. Always do your own research and manage your risk before trading.

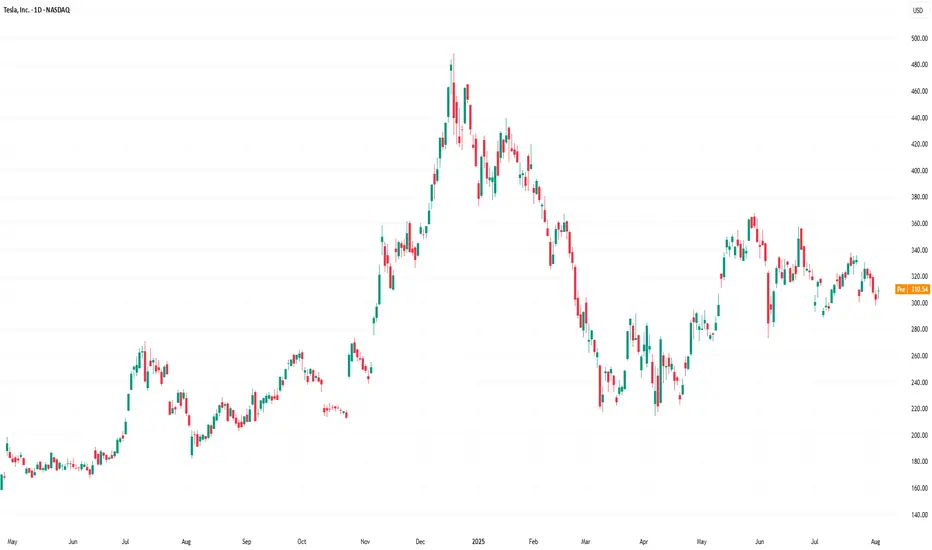
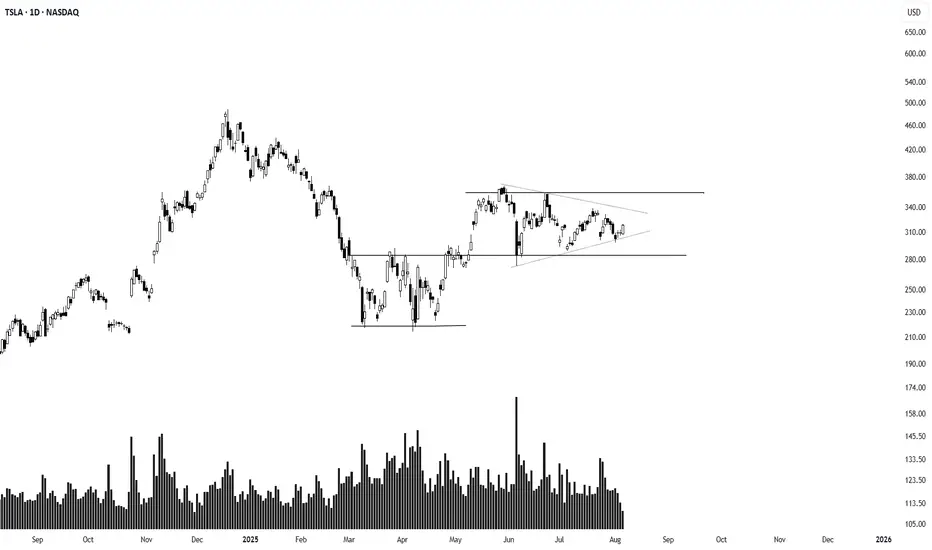
Tesla Breakout? For the majority of the calendar year TESLA has been in a range between $220 - $365 with a clear midpoint of $295.
From March to the beginning of May TESLA bounced between range low and the midpoint until finally breaking through into the upper half of the range where it has stayed ever since. However, there is a clear diagonal resistance level that is preventing higher highs.
So will TESLA breakout, or will it lose the midpoint? Structurally it is clear that the bulls have a set level they are happy to buy at (Midpoint) but the bears are getting more aggressive with their selling, hence the lower highs. This compression inevitably leads to an impulse move but the direction is not so clear.
Bullish scenario: A clean breakout with volume that makes a new higher high, signaling a shift in structure. A pullback and retest of the breakout would be an ideal opportunity to go long and aim for that range high before expecting resistance.
Bearish scenario: The lower highs keep printing until the midpoint is lost and price accepts below it, that would then signify to me the new trading range is between Range Low and Midpoint.
The fakeout scenario is a risk but with price so close to the midpoint already it follows the same invalidation criteria as the bullish scenario, the midpoint is vital to both sides.


Tesla's Consolidation Suggests Breakout Potential—Act Current Price: $329.65
Direction: LONG
Targets:
- T1 = $336.50
- T2 = $343.00
Stop Levels:
- S1 = $326.00
- S2 = $322.00
**Wisdom of Professional Traders:**
This analysis synthesizes insights from thousands of professional traders and market experts, leveraging collective intelligence to identify high-probability trade setups. The wisdom of crowds principle suggests that aggregated market perspectives from experienced professionals often outperform individual forecasts, reducing cognitive biases and highlighting consensus opportunities in Tesla.
**Key Insights:**
Tesla is currently in a crucial consolidation phase, reflected through a wedge pattern that indicates mounting pressure for a directional breakout. The company continues to impress investors with innovations such as its progression toward robo-taxi certification and mobility expansion via its Texas ride-share license. These developments, coupled with its robust growth narrative, make Tesla an attractive asset. However, technical indicators suggest that traders should monitor key resistance and support levels to capture the market's next move effectively.
Furthermore, the stock is positioned in a high-volatility zone, where its MACD crossover and RSI steadying near 50 emphasize the possibility of a bullish breakout. Analysts suggest that a breach above $335 could unlock upside momentum, while a failure to hold $326 might trigger temporary pullbacks.
**Recent Performance:**
Tesla has displayed strength despite broader market volatility, posting a 2.2% gain over the last week as the tech sector corrected from recent highs. The stock has stayed within the $325–$335 range, consolidating gains from earlier upward movements. This stability contrasts with the momentum seen in other tech giants, suggesting Tesla might be gearing up for its next leg higher. Institutional investors appear to be eyeing this stock as a value play within the stretched valuation landscape of mega-cap peers.
**Expert Analysis:**
Experts view Tesla's consolidation as a bullish wedge, where lows are climbing and highs are becoming narrower. This formation often precedes breakout events, and the setup aligns with Tesla's steady operational performance. Sales growth in key Asian markets has remained strong, countering lukewarm European results. With external catalysts such as macroeconomic data and Fed decisions percolating in the background, Tesla's rebound potential could align seamlessly with improving overall market sentiment.
The $335–$345 range is identified as a breakout area; sustained movement above this level could shift into higher gear. Sentiment, which has recently flipped neutral-positive, supports a move to retest $343 in the near term.
**News Impact:**
Tesla's innovation spree and operational wins, such as advancements in its autonomous driving technology, along with receiving new mobility certifications in Texas, provide bullish tailwinds.However, mixed international sales add a hint of caution to the growth story. Still, its position as a leading innovator in the renewable energy and EV space ensures consistent market attention.
**Trading Recommendation:**
Tesla's consolidation presents a compelling risk-reward scenario. A long trade is recommended with entry near $329.65, targeting $336.50 and $343.00. Stops should be placed at $326.00 and $322.00 to mitigate downside risks. This strategy aligns with technical setups and the company's overall growth narrative. As sentiment improves and fundamentals align, Tesla could be poised for its next major move upward. Timing a breakout entry is crucial, so traders should remain vigilant for confirmation signals this week.

TSLA – Testing Key Gamma & Structure Levels. TA for Aug. 6TSLA – Testing Key Gamma & Structure Levels
Technical Overview
TSLA has been consolidating just under a key resistance zone at 310–312, which also aligns with the highest positive GEX / gamma resistance area. Price is forming a higher-low structure off the 303–305 support trendline, suggesting buyers are still defending key levels despite recent selling pressure.
MACD is flattening out and Stoch RSI is cycling near mid-range, indicating a potential momentum build but no confirmed breakout yet.
GEX / Options Sentiment
* Gamma Resistance: Heavy call wall at 312 with 52% concentration, and further stacked resistance into 320–325. This creates a ceiling unless strong bullish momentum steps in.
* Gamma Support: Large put positioning at 300 (-64% concentration) and 295 acting as a key defensive floor.
* Dealer Positioning: Above 312, gamma flip could drive momentum toward 320–325 quickly. Below 300, dealer hedging could accelerate selling into 295 and possibly 290.
Trade Scenarios
Bullish Case
* Trigger: Break & hold above 312 with volume.
* Target 1: 320
* Target 2: 325
* Stop: <305
Bearish Case
* Trigger: Close below 300 with momentum.
* Target 1: 295
* Target 2: 290
* Stop: >312
Options Thoughts
* Bullish: Consider short-term calls if price breaks above 312 with strong volume and momentum confirmation.
* Bearish: Consider puts targeting 300 if rejection occurs at 310–312 and sellers regain control.
* Neutral / Premium Selling: Selling an iron condor around 295–325 could work if expecting continued range trading until a catalyst emerges.
📌 My Take: TSLA is coiling for a decisive move. GEX shows a tight battle between 312 call resistance and 300 put support. A break in either direction could lead to a fast expansion move. I’m leaning neutral-to-bullish as long as 305 holds, but I’ll switch bearish if 300 breaks.
Disclaimer: This analysis is for educational purposes only and not financial advice. Always do your own research and manage risk accordingly.
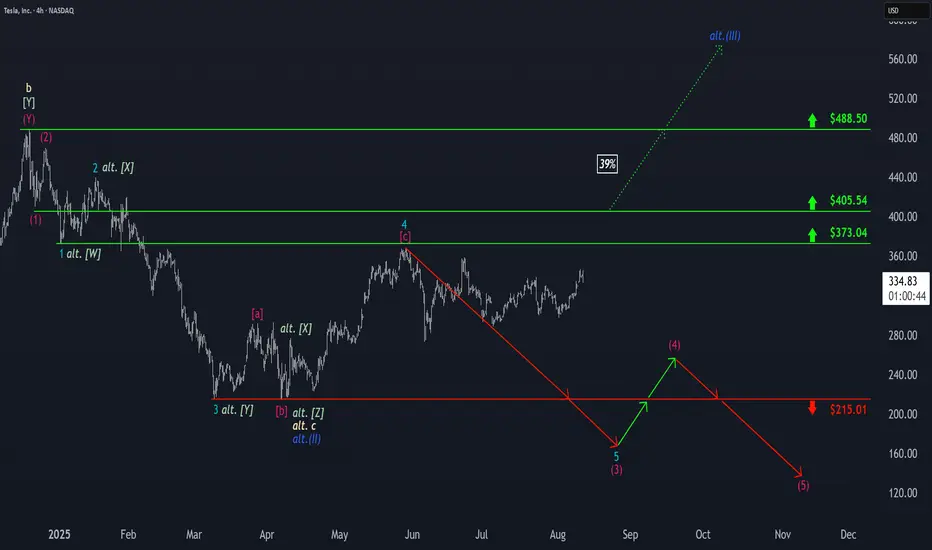
Tesla: Upward Pressure, but Bears May Soon Regain ControlTesla has once again faced upward pressure, which pushed the stock toward resistance at $373.04. However, our primary expectation is that the bears will soon regain control, setting off further sell-offs within the ongoing downward impulse. Step by step, this magenta five-wave move is expected to break below support at $215.01. If price moves above the $373.04 level, our alternative scenario will become significantly more relevant. If the stock even surpasses the higher threshold at $405.54, we will ultimately shift to this alternative view and classify Tesla as being in a sustained uptrend of blue wave alt.(III) , which would extend beyond $488.50. In this 39% likely scenario, wave alt.(II) would already be complete.
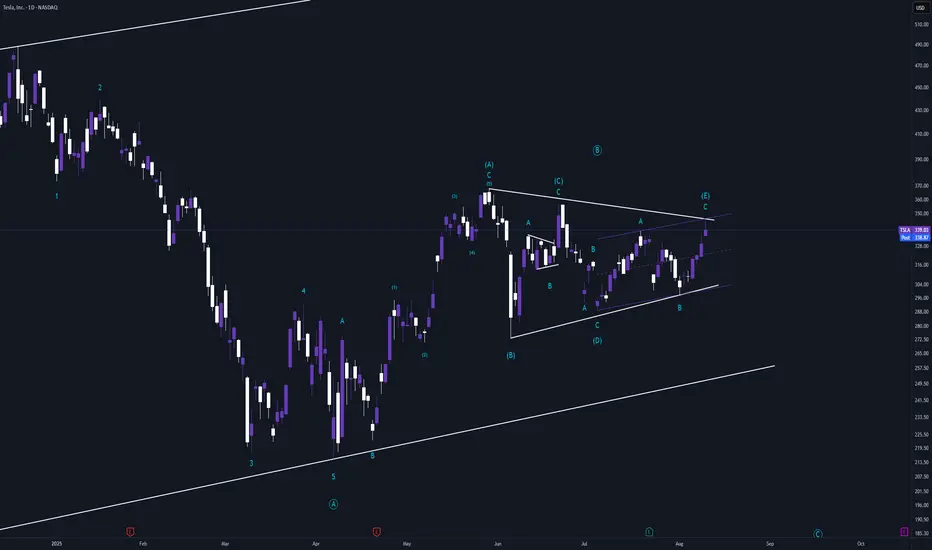
TSLA Potential Triangle FinishSeeing a lot of pots around the TSLA breakout. The rejection off the top of the ABC channel starting in July makes me think that this triangle is in play and TSLA will begin heading back down from here. Invalidation above 357.
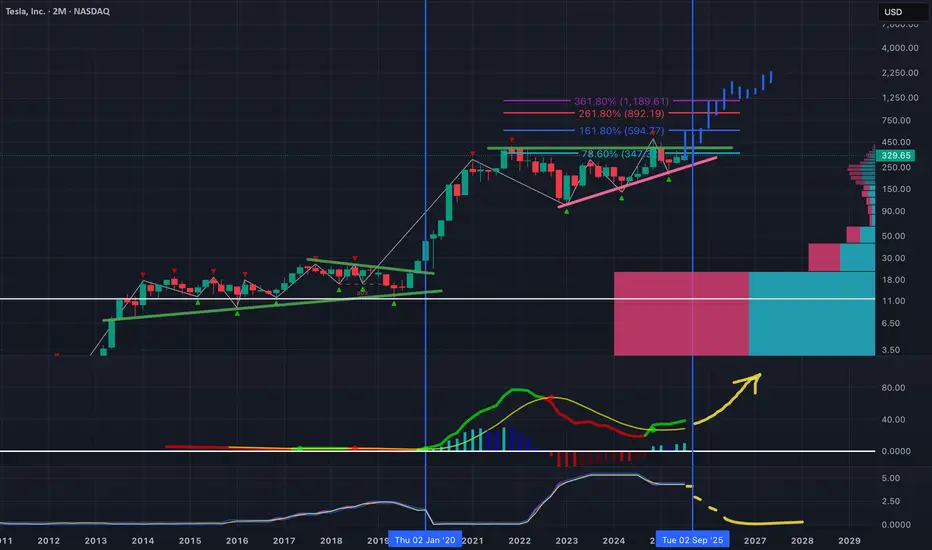
$TSLA - High CAGR Strikes againTesla’s long-term bullish structure remains intact on the 2-month logarithmic chart, with price breaking out of a two-year ascending triangle capped near $350. This move tests the 78.6% retracement level at $347, opening the door to Fibonacci extension targets at approximately $595, $892, and $1,189 if momentum follows through.
The volume profile highlights strong historical support in the $180–$250 range, a key zone to defend on any pullback. Notably, the macro backdrop adds a tailwind — the last significant Fed rate cut in early 2020 coincided with Tesla’s parabolic advance, and the next major cut is projected for late 2025.
Long-term momentum indicators are turning higher, suggesting the early phase of a new bullish cycle. A sustained hold above $300 on any retest would reinforce the breakout, while a drop back under $280 risks a move toward $200–$220.
I wouldn't want to be short long term.
TESAL HEADING TO $500+ RANGE ANALYSIS HERE Afternoon Trading Fam
So here is our in-depth look at Tesla: Currently the monthly trend is bullish giving us levels of $500 and above.
Locally though we can break this $338 top expect to see $444 and $480 getting hit next
If we need to correct and we break the lows of $319 expect to see the levels of $307 then $301 being hit
Happy Trading
Trade Smarter Live Better
Kris

TSLA nearing breakout TSLA’s been winding tighter for weeks, and we’re finally pressing right up against the top of this symmetrical triangle on the 4H chart. Sitting at $333 price level after breaking out of that $315 area with some momentum behind it. Volume’s picking up, RSI’s pushing north of midline, and the MACD just flipped bullish.
If we can get a clean break and hold above that $335–$340 range, there’s room to stretch toward $367–$370, basically a retest of those June highs. But if we get rejected here, we probably stay stuck in this coil a bit longer. This is one of those decision point moments for TSLA where the next few candles could tell the story.

Tesla Forming an ApexTesla is tightening up into an Apex formation. We are seeing volume spikes at the lows which could signal a breakout to the upside, but still need confirmation of this.

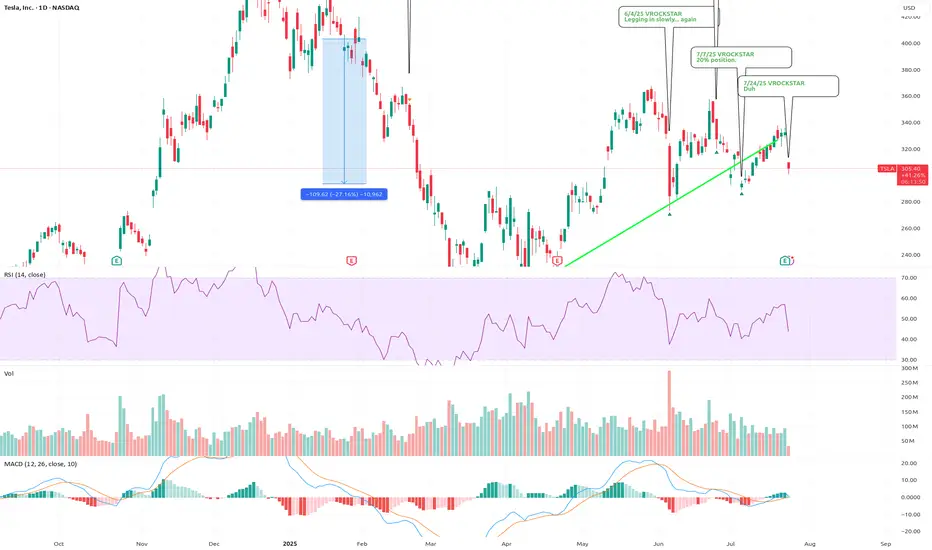
7/24/25 - $tsla - Duh 7/24/25 :: VROCKSTAR :: NASDAQ:TSLA
Duh
- ppl focused on ST FCF (all over X!) is 100% of the reason why when you put the pieces together, you realize that while ST this might not behave like anyone expects... LT, TSLA is v likely going to in, elon's own words, be the largest cap in the history of capital markets
- two leading robots with leadership position in IRL AI
- profitable, is all that matters
- have not yet hit the S-curve
was super lucky to trim some of this last week
now i'm back to sizing into a full position, not yet there like on that silly political dump, but i'm nearly 10% (20% is my max size).
V
$TSLA 3rd Time's a CharmI bottom called NASDAQ:TSLA twice in a row. About to do it a third time today. 312.5C 8/8 @ 4.47 were just bought for $1.3 million.
UPTADE TESLA -- 250 USD still potentialTesla is consolidating in a tight range, showing bearish pressure near the lower boundary of the formation. Moving averages (MA 5/10/30/60) are flattening, indicating a loss of bullish momentum, while the Wavetrend oscillator has issued a sell signal (bearish crossover below the zero line). A downside breakout from this range projects a potential move toward the $250 level, as illustrated by the measured move. This bearish scenario gains validity if price breaks below the $315 support level.
Potential TP still 250 USD

Leave your comment about TESLATesla is in a flag pattern on the daily time frame and I think there is fire under the ashes! Breaking the upper side of the triangle is good news for its holders.
TSLA, Beyond the candlesTSLA has been printing back-to-back bounce signals, with higher lows forming consistently.
Hoping this leads to a sustained uptrend.
